NASDAQ - Shorts Ready ✅In our last Nasdaq analysis, we had a higher timeframe overview and we indicated that we wanted to move down once more to get to our perfect buy area.
We had a complex correction for the bigger wave C. We can see that we are in a 3 wave correction with wave B having a sub 3 wave correction which recently completed.
Looking to take NASDAQ down to around the 15500 level.
Trade idea:
- Enter with stops above the recent highs
- Target the 15500 as targets (1300pips)
Be sure to use risk management with this trade as indices are really volatile.
See below for our last Nasdaq analysis:
Goodluck and trade safe!
UK100 CFD

DAX H16: BEST Level to SHORT IT +1000/+1500 points(SL/TP)(NEW)Why get subbed to me on Tradingview?
-TOP author on TradingView
-2000+ ideas published
-15+ years experience in markets
-Professional chart break downs
-Supply/Demand Zones
-TD9 counts / combo review
-Key S/R levels
-No junk on my charts
-Frequent updates
-Covering FX/crypto/US stocks
-before/after analysis
-24/7 uptime so constant updates
🎁Please hit the like button and
🎁Leave a comment to support our team!
DAX H16: BEST Level to SHORT IT +1000/+1500 points(SL/TP)(NEW)
IMPORTANT NOTE: speculative setup. do your own
due dill. use STOP LOSS. don't overleverage.
🔸 Summary and potential trade setup
::: DAX 16hour/candle chart review
::: BUY alerted at 15100 +700 points now
::: trading in massive range since May 2021
::: 16000 range highs / 15000 range lows
::: focus on BUY LOW / SELL HIGH strategy
::: we will trade sideways next 4/8 weeks
::: bearish fractal in progress now
::: setup still valid as of today
::: new wave of global lockdowns
::: upside limited from here
::: short-term limited upside
::: HOWEVER heavy resistance overhead
::: 15 900 strong resistance
::: get ready to SHORT from overhead
::: BEARS will take over soon
::: lower risk setup is SHORT
::: get ready to SHORT HIGH later
::: once we hit resistance at 15 900
::: TP BEARS TP1 +1000 points TP2 +1500 points
::: SHORT/HOLD setup with great risk:reward
::: BEARS TP FINAL is 14 800
::: recommend to SHORT/HOLD
::: recommended strategy: SHORT/HOLD
::: 15 900 reversal level to SHORT IT
::: BULLS focus on BUYING LOW
::: near 15 000 / 15 200 later
::: TP BULLS is 15 900 points
::: SWING trade setup do not expect
::: fast/miracle overnights gains here
::: good luck traders
🔸 Supply/Demand Zones
::: 15 000 fresh demand zone
::: 15 850 fresh supply zone
🔸 Other noteworthy technicals/fundies
::: TD9 /Combo update: N/A
::: Sentiment short-term: BEARS
::: Sentiment outlook mid-term: BEARS
RISK DISCLAIMER:
Trading Crypto, Futures , Forex, CFDs and Stocks involves a risk of loss.
Please consider carefully if such trading is appropriate for you.
Past performance is not indicative of future results.
Always limit your leverage and use tight stop loss.

UK100: BearishUK100 has created a sell profile again.
Note: This is a second entry after the initial longterm entry.

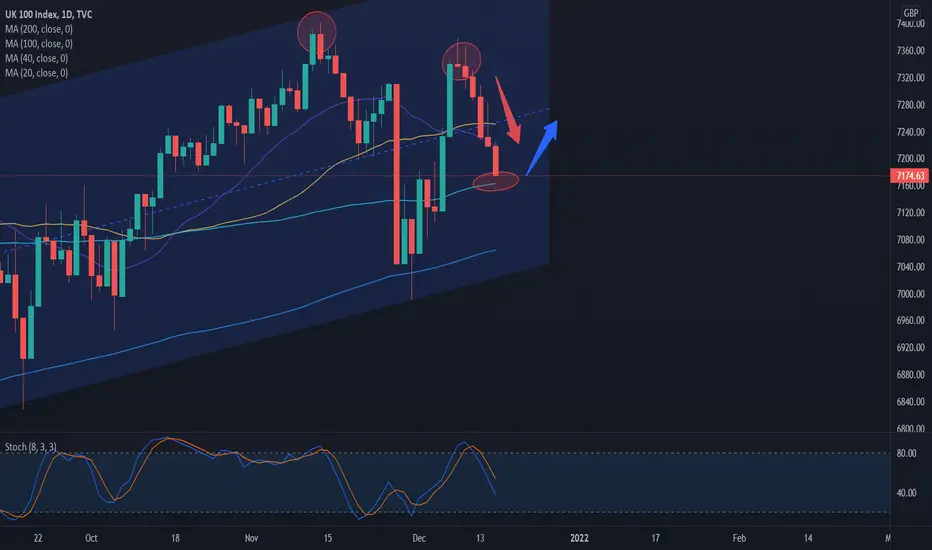
FTSE rebound from the hit.Don't forget to click on the follow button for more daily detailed analysis. Also if you have any questions please do ask them!
We were previously looking short on the FTSE and our targets were hit. We are now looking long as we fall to comfortable support.
The FTSE was knocked by sentiment around the current covid news and it's affect on the UK economy from a demand shut down.
Long entry comes as TECHs line up. RM will be in focus as sentiment changes. This means keeping an eye accurately on risk and adding.
Directional arrow notes price movement.

UK100Buy Order placed for a short term buy. UK100 is bearish on a hgher timeframes so this is a short term trade and should be managed carefully.

FTSE to dip..For more daily detailed analysis, don’t forget to click on the following button. Also, please ask any questions you may have and I will be happy to answer them.
Recently, we looked long to our current targets. Sentiment from the CB meeting drove price nicely up.
We can now look short as we approach our TECH short zones.
UK100 - Short Trade Idea - 7150 targetUK100, 15m Sell
Entry - 7192.8
Stop Loss - 1207.4 (14.4 pips)
Take Profit - 7152.8 (40 pips)

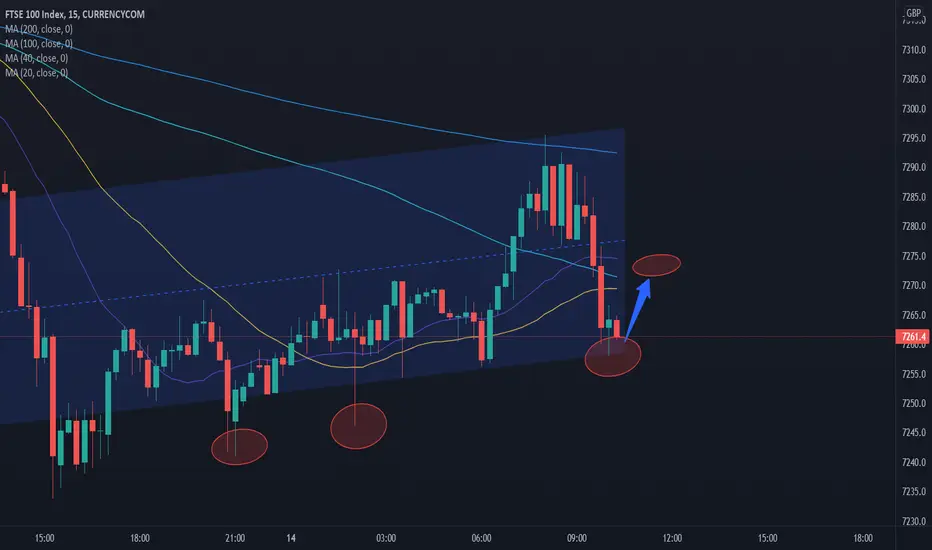
FTSE to riseFor more daily detailed analysis, don’t forget to click on the following button. Also, please ask any questions you may have and I will be happy to answer them.
We recently went short on the FTSE and targets were smashed yesterday.
Currently, COVID news sentiment and high inflation reports are moving this asset. In the very near term, the news will likely give us even more sentiment.
We are now looking to go long on the FTSE with an upside target.
We are at comfortable support with other technical aspects in our plan.
UK100 Descending Triangle Price closed below EMA 10, EMA 20, and Horizontal Support Resistance Level.

FTSE crawling upDon't forget to Click on the follow button for more daily professional analysis. Also if you have any questions, please do ask them!
Here we have our updated FTSE 100 chart.
We are looking long on this bounce at higher TFS.
MA's are creating a good profit margin and we are UP trending.
Remember we want to trade with the current flow of the market at any time.
UK 100 Slowly turning over..Don't forget to click on the follow button for more daily Professional analysis. Also if you have any questions, please do ask them!
Here we have our FTSE index.
We are still looking short as price returns to previous highs.
Price is now stalling on the current news sentiment and has room to fall.
We are shorting down to a comfortable area of support.
Targets and price movement is noted by directional arrows.

FTSE pending planDon't forget to Click the follow button for more daily professional analysis. If you have any Questions, please do ask them!
Here is our FTSE chart,
Similarly to yesterday we are waiting for some sentiment to RE kick in.
We should see a fall back to more reasonable areas and comfortable support.
Target is labelled with our directional arrow.

$FTSE Can Rise One More Time To Fall - Important Key To MarketsTraders, FTSE (UK100) completed a huge bearish W pattern which gave us the level 7339. (See the attached idea). It missed the an important pre-covid level where we have a gap left. Last time it came very close and fell down for an initial reaction to create a bear trap. Now it will most probably try again to close that gap up and collect few stop losses around the FCP zone. This can be very good opportunity to short FTSE100 market for longer term.
US30 (Dow Jones), US500 (SNP500) and NASDAQ (NAS100) all have been closing their past gaps. US30 has few left close to all time high. As these gaps are closed on the high side, only bottoms ones will remain. FTSE is one of them. Having said that, do not take gap in to your trading strategy as gaps may take years and decades to fill.
Trade what you see and keep the risk management tight.
Rules:
1. Never trade too much
2. Never trade without a confirmation
3. Never rely on signals, do your own analysis and research too
✅ If you found this idea useful, hit the like button, subscribe and share it in other trading forums.
✅ Follow me for future ideas, trade set ups and the updates of this analysis
✅ Don't hesitate to share your ideas, comments, opinions and questions.
Take care and trade well
-Vik
____________________________________________________
📌 DISCLAIMER
The content on this analysis is subject to change at any time without notice, and is provided for the sole purpose of education only.
Not a financial advice or signal. Please make your own independent investment decisions.
____________________________________________________

UK 100 slowly slowly..Don't forget to click the follow button for more daily professional analysis,
Here we have our little unchanged UK 100 chart.
The current rally and market sentiment has driven this asset back to recent highs.
Price is way too high now and at sell zones we formerly discussed.
We are now looking short back down to former Support and our Key MA's.

Short Opportunity on UK100 According to FIBO Retracement
Divergence between the CCI with Price Move on Chart
Price Action / Minor Trendline Broken , now Re tested

UK 100 Short planDon't forget to Press the follow button after reading for more daily professional analysis,
Here we have our FTSE or UK 100 chart.
On the current positive news sentiment around the omicron variant, we have seen a huge rally.
We are looking short at we approach recent highs.
Short TGT noted by the directional arrow.


UK 100 Short planDon't forget to click on the follow button after reading for more daily Professional analysis.
Here we have our UK 100 chart.
On the current rise, we are now looking to short back down to some key support and MA's, with our target identified with the directional arrow.


FTSE intraday shortGood Morning, afternoon and evening traders! Don't forget to click the follow button after reading my post for more expert daily analysis.
Here we have our frequently traded FTSE 100 chart.
We are up on the day from current UK market sentiment attacking some key resistance.
We are looking for an intraday short this morning back down.

UK100 ready for a short!! (sunday at opening)Dear traders,
First of all, enjoy your weekend and have a great sunday.
Ofcoure our weekend is time to backtest and our sunday is used for preperation for the upcoming week.
1 trade that we are sure to trade, probably at open on Sunday, is the UK100.
This pair has shown an impulse downward move followed by a correction wich took a while.
This corrective move basically showing us that the bulls didnt find enough power to have the upperhand.
Bears are taking over.
As shown in our chart we can see that there was a counter-trendline wich held for a day, after it broke structure it retested and got rejected.
After the break of structure all the timeframes that we are interested in are aligning perfectly and we are ready to trade.
To wrap things up:
Sunday at open we will be interested in taking a short trade on the UK100 because of the indicators, timeframes and structure on these timeframes that align.
Wishing you an amazing trading week and stay safe!
Kind regards,
Tim.

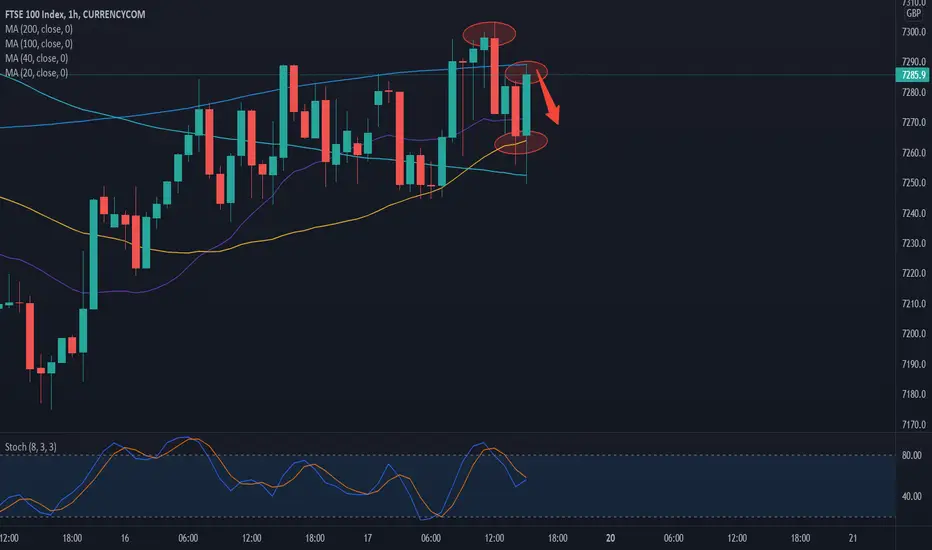
UK 100 Bearish intradayFor more detailed analysis, don't forget to hit the like and follow button.
Here we have our UK 100 chart.
After our targets were hit yesterday we are now looking short for intraday gains.
We are already seeing some price rejection at recent 1H highs and looking for this to continue.

FTSE 100 intradayFor more daily detailed analysis from myself, don't forget to click on the follow button.
Along with other important markets, the FTSE is seeing some sideways movement over current market indecision.
Often at these times, price will move either way eventually.
Price direction is noted by the arrow.
