UK100 Moved above area of interest. Is Price about to DROP?UK100 is 'busting accounts'. Now it is time to get some payback? Price is hitting upper resistance. Risk to Reward is insane.
UK100 CFD


FTSE 100 - Can it clear the cluster of resistance?We look to Sell at 7445
Bespoke resistance is located at 7445
Positive overnight flows lead to an expectation of a firm open this morning
We have a 61.8% Fibonacci pullback level of 7432 from 7729 to 7003
Although the anticipated move lower is corrective, it does offer ample risk/reward today
Expect trading to remain mixed and volatile
Stop: 7485
Target 1: 7275
Target 2: 7205

Ferguson - Turning up the heatBuy Ferguson (FERG.L)
Ferguson PLC is a distributor of plumbing and heating products. The Company operates through seven business units: Blended Branches, Waterworks standalone, HVAC standalone, Industrial standalone, Fire and Fabrication, Facilities Supply standalone and B2C e-commerce.
Market Cap: £15.35Billion
Ferguson is trading in a bullish long term channel. The shares are trading just below all time high and there is no sign of the momentum slowing. The small corrective move lower in recent days has attracted buying interest and a move to new highs is expected.
Stop: 6545p
Target 1: 7200p
Target 2: 7600p
Target 3: 8000p
Interested in UK Stocks?
Join our free Telegram channel for up to date analysis on the best main market opportunities in the UK right now - t.me

Convatec - Chronically undervalued?Buy Convatec (CTEC.L)
ConvaTec Group PLC is a United Kingdom-based medical product and technology company. The Company focuses on therapies for the management of chronic conditions, including products used for advanced chronic and acute wound care, ostomy care, continence and critical care and infusion devices used in the treatment of diabetes and other conditions.
Market Cap: £3.79Billion
The recovery over the medium term continues as the shares trade in a sequence of higher highs and higher lows. The recent corrective move back to the trend line has attracted some buying interest. The formation and break of a small wedge is also an encouraging sign that we can expect a continuation. There is an unfilled gap at 223p to target on the upside.
Stop: 181.6p
Target 1: 211p
Target 2: 222p
Target 3: 240p
Interested in UK Stocks?
Join our free Telegram channel for up to date analysis on the best main market opportunities in the UK right now - t.me

BT - Dialling upBuy BT Group (BT.A.L)
BT Group plc is a communications services company. The Company is engaged in selling fixed-voice services, broadband, mobile and television products and services, as well as various communications services ranging from phone and broadband to managed networked information technology (IT) solutions and cyber security protection.
Market Cap: £18.96Billion
BT has broken out of a channel pattern on the daily chart. The breakout move has retraced 50% of the impulsive move higher and retested the broken channel. The shares appear to be stabilising around 185p, while the Conservatives remain in the lead in the opinion polls then the shares could continue higher in relief of avoiding the threat of part nationalisation from a Labour Government.
Stop: 181.6p
Target 1: 212p
Target 2: 230p
Target 3: 265p
Interested in UK Stocks?
Join our free Telegram channel for up to date analysis on the best main market opportunities in the UK right now - t.me

Barclays - Heading higherBuy Barclays (BARC.L)
Barclays PLC is a global financial service holding company. The Company is engaged in credit cards, wholesale banking, investment banking, wealth management and investment management services.
Market Cap: £29.60Billion
Barclays appears to have completed an inverse head and shoulders bottom pattern back on the 11th of October 2019. The shares continue to hold up well as a Conservative win at the upcoming election remains the most likely outcome. the medium-term target is up at 200p.
Stop: 163.65p
Target 1: 181p
Target 2: 193p
Target 3: 200p
Interested in UK Stocks?
Join our free Telegram channel for up to date analysis on the best main market opportunities in the UK right now - t.me

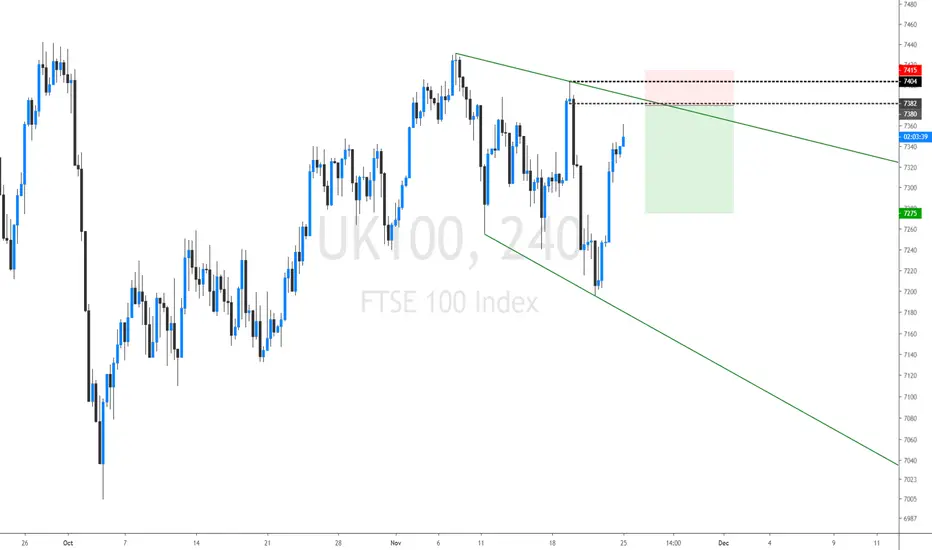
FTSE 100 - Possible sequence of lower highs.We look to Sell at 7380
Trading has been mixed and volatile.
The trend of lower highs is located at 7382.
Positive overnight flows lead to an expectation of a firm open this morning.
Preferred trade is to sell into rallies.
Expect trading to remain mixed and volatile.
Stop: 7415
Target 1:7275
Target 2: 7200

UK100 - If you like big money moves UK100 delivers?When UK100 moves, it moves Big - Big Losses - Big Wins. Is your psychology right for this pair? Well it time to 'mine for diamonds' (Fib ABCD patterns). We hit a deposit. So let's fill our buckets and get out of here!! Let's see what pattern forms at this area of interest 'C'. Then, we will see if it tunnels over to 'D'. Remember - You only need a small chunk out of UK100, don't stay in too long til it starts to bite back.

FTSE 100 - Selling ralliesTrade Idea
Broken out of the channel formation to the downside.
Continued downward momentum from 7404 resulted in the pair posting net daily losses yesterday.
Negative overnight flows lead to an expectation of a weaker open this morning.
Further downside is expected although we prefer to set shorts at our bespoke resistance levels at 7310, resulting in improved risk/reward.
Expect trading to remain mixed and volatile.
We look to Sell at 7310
Stop: 7355
Target 1; 7095
Target 2: 7005

FTSE trade updateAfter yesterday's news from USA, that they back Hong Kong's bill, China said they will retaliate if it becomes a law. Tensions arise and we are back in risk off mood.
Now approaching big support soon and 200SMA. A break lower for a short. A bounce of support before continuation may offer earlier entry with better risk-reward.
Good Luck!

SSE - Electrifying potential gainsBuy SSE (SSE.L)
SSE plc is engaged in producing, distributing and supplying electricity and gas, as well as other energy-related services to homes and businesses in Great Britain and Ireland.
Market Cap: £13.35Billion
SSE broke above resistance on a move above 1237p back in October. The shares have since corrected to retest the new support and now appear to be attracting fresh buying interest. The close above the 10EMA and the completion of a bullish flag suggests that more upside is likely in the short term.
Stop: 1223p
Target 1: 1330p
Target 2: 1477p
Target 3: 1625p
Interested in UK Stocks?
Join our free Telegram channel for up to date analysis on the best main market opportunities in the UK right now - t.me

Bellway - Building momentumBuy Bellway (BWY.L)
Bellway plc is a major UK residential property developer based in Newcastle upon Tyne. It is listed on the London Stock Exchange and is a constituent of the FTSE 250 Index.
Market Cap: £3.9Billion
The medium-term trend is bullish on Bellway. The shares have corrected lower in recent weeks and appears to have found some support at 3125p. There was strong move higher in yesterday’s session and further upside towards resistance at 3710p is expected in the short term.
Stop: 3078p
Target 1: 3600p
Target 2: 3710p
Target 3: 3800p
Interested in UK Stocks?
Join our free Telegram channel for up to date analysis on the best main market opportunities in the UK right now - t.me


UK Market - Impulse move in the making.Two points of view are provided in the chart as two scenarios are both likely.
Upside has a target of £10,000, Pivot level at £6,000 and downside target of £4,500.
The wedge, price stalling and curvature of the price action up to the wedge, tells that there is a possibility for a rejection from a recovering bull market and into a financial recession. Fundamental data will appropriately explain and show which direction the FTSE takes.
Personally neutral on this, both are likely in my playbook - however I think there's more reason for recovery and continuation upwards because of geopolitics more than technical analysis.

FTSE100: Double Buy Target.The index has broken above both the 1D MA50 and MA200 this week and 1D turned bullish (RSI = 57.795, MACD = 3.690, Highs/Lows = 85.3366) towards the 7,440 Resistance. It appears to be repeating the April - July sequence, currently being at the start of the final (and most aggressive) bullish leg. The obvious short term target is the 7,440 Resistance but in our opinion, and with the 1D RSI potential, if the 1D candle that breaks the Resistance closes above that level, we can extend the uptrend as high as 7,620.
** If you like our free content follow our profile (www.tradingview.com) to get more daily ideas. **
Comments and likes are greatly appreciated.


Compass Group - Buying the dip to the long term trend line.Buy Compass Group (CPG.L)
Compass Group PLC provides food and support services. The Company's segments include North America, Europe, Rest of World and Central activities. The Europe segment includes Turkey and Russia. The Rest of World segment includes Japan. The Company delivers services in sectors, including business and industry; healthcare and seniors; education; defense, offshore and remote, and sports and leisure.
Market Cap: £31.19Billion
Compass is trading in a fantastic long-term uptrend and this is showing no signs of stopping. The latest correction appears to have found some buying support at the long-term trend line. We expect the shares to rally towards the upper end of the corrective channel before eventually breaking higher towards new highs.
Stop: 1890p
Target 1: 2050p
Target 2: 2145p
Target 3: 2250p
Interested in UK Stocks?
Join our free Telegram channel for up to date analysis on the best main market opportunities in the UK right now - t.me

AstraZeneca - Breaking from a wedgeBuy AstraZeneca (AZN.L)
AstraZeneca PLC (AstraZeneca) is a biopharmaceutical company. The Company focuses on discovery and development of products, which are then manufactured, marketed and sold. The Company focuses on three main therapy areas: Oncology, Cardiovascular & Metabolic Disease (CVMD) and Respiratory, while selectively pursuing therapies in Autoimmunity, Infection and Neuroscience.
Market Cap: £90.48Billion
AstraZeneca is breaking higher from a corrective wedge pattern on the daily chart. The long-term uptrend remains bullish and a move towards new highs is expected.
Stop: 6565p
Target 1: 7465p
Target 2: 7580p
Target 3: 8000p
Interested in UK Stocks?
Join our free Telegram channel for up to date analysis on the best main market opportunities in the UK right now - t.me

RBS - Set to correct lower?Sell RBS (RBS.L)
The Royal Bank of Scotland Group plc (RBS) is a banking and financial services company. The Company provides a range of products and services to personal, commercial, corporate and institutional customers, through its subsidiaries, The Royal Bank of Scotland plc and National Westminster Bank Plc (NatWest), as well as through other brands, including Ulster Bank and Coutts.
Market Cap: £29.13Billion
RBS appears overdone in the very short term. The shares have benefitted significantly form the rally in GBP over recent weeks with a 30%+ rally from the October lows. The shares have rallied into an unfilled gap at 247.4p, which was created on the 26th April 2019. This also corresponds with a 78.6% Fibonacci retracement level from the highs at 266.1p on the 17th April to the lows at 176.6p on 15th August 2019. The looks to be a reasonable level to take some short-term profit or initiate some speculative selling. The bearish looking candle on the daily chart adds further weight to the bearish argument.
Stop: 250.5p
Target 1: 232p
Target 2: 217p
Target 2: 197p
Interested in UK Stocks?
Join our free Telegram channel for up to date analysis on the best main market opportunities in the UK right now - t.me
