Strifor || USDCAD-07/13/2023Preferred direction: SELL
Comment: When approaching the support level of 1.31385, the currency pair immediately received a signal from buyers and rebounded. However, most likely this is a partial fixation of sellers whose ambitions locate below this support. By the end of this week, it is expected that the instrument will drop below this level. Before the weekend, the currency pair is likely to begin to recover slightly.
Thank you for like and share your views!
Crude Oil Brent

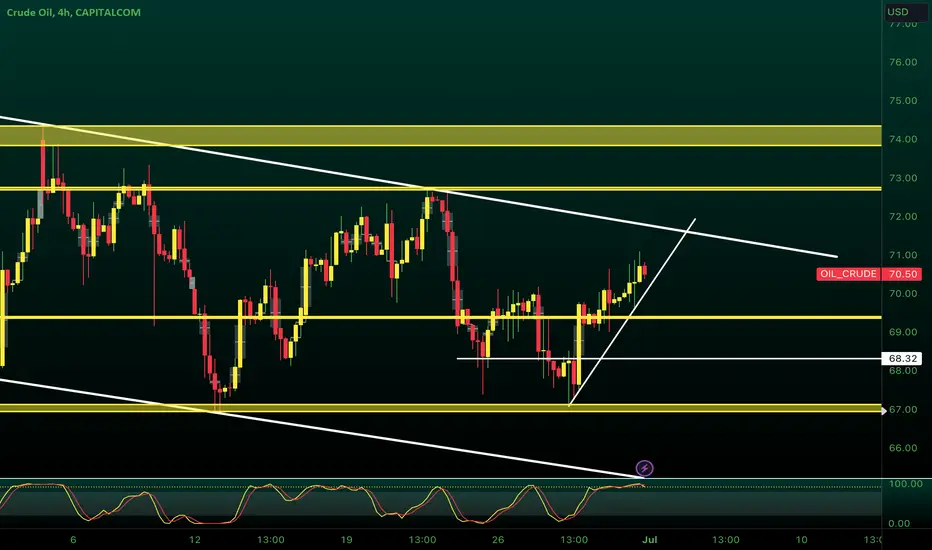
USOIL WTI Crude Supply And Demand AnalysisSee picture for analysis:
-Price reacting off of supply
-Price below 200MA + soon to be reacting off of MA.
-Breakout-Sl hunt
-Looking fro shorts with confirmation on smaller timeframes.

Crude Oil (WTI): Top-Down Analysis & Trading Plan 🛢️
WTI Crude Oil is retesting a broken horizontal key level.
The price formed a cup and handle pattern, approaching that.
The neckline of the pattern was broken.
I believe that the market will resume the growth soon
Goals: 73.8 / 74.4
❤️Please, support my work with like, thank you!❤️

Crude Oil (WTI): Bullish Outlook Explained 🛢️
WTI Crude Oil is very bullish since the end of June.
The market even managed to break and close above a key horizontal resistance on a daily.
The broken structure turned into support now.
That constitutes a safe zone to buy from.
I believe that probabilities will be high that the market will keep growing.
Next resistance is 74.7
❤️Please, support my work with like, thank you!❤️

USDWTI H4 - Short SignalUSDWTI H8
Rejections already started from this $73.50/b price. Possibly looking to set pending orders for that $73.50/b price, depending on how things are looking.
The range has been filled and has held from resistance to support and support to resistance for almost 2.5 months now.

WTI UpdateThe price appears to bounce back as expected, with OPEC+ output curbs finally biting. Russia announced a voluntary decrease of 500 kbd that will remain through the end of August.
The technical context entails an acceleration in wave [ 3] of iii.
Most ElliottWave traders aim for a third of the third when the price moves a considerable distance with no noticeable pullback.
I don't have any alternative options now, but given how difficult it was to pick the bottom, I won't celebrate until the end of the move.
The larger picture stays unchanged. Either a triangle as wave Y of (X) that will last until the end of 2023 or a more sharp rally as wave C of (X) (black labels).
I'll reiterate that waves wxy of (b) and [ w] [ x] [ y] of wave ii are a little complex, which is typically a bad sign. However, I'm struggling to come up with an immediate bearish scenario.

Crude Oil (WTI): Breakout & Bullish Continuation 🛢️
WTI Crude Oil was trading within a horizontal trading range since the beginning of June.
Its resistance was finally broke yesterday.
It is a very important sign of strength of the buyers.
The market will most likely keep growing 75.75 level - next key resistance.
❤️Please, support my work with like, thank you!❤️

UKOIL(BRENT)-07/05/2023Preferred direction: BUY
Comment: The long idea for oil has been working out very well and after completing the planned path earlier, the level of 77.39 opens for the buyer. A rather difficult obstacle for the buyer, because if not for it, then the price could rise above 78 from the current ones on the impulse. Therefore, in the near future, an approach to 77.39 is expected, then consolidation (most likely) and after a rise above 78.
Thank you for like and share your views!

USDCAD-07/03/2023Preferred direction: SELL
Comment: Despite the fact on Friday the downward impulse after breaking out the lower border of the balance did not take place, the priority of sell remains. However, the action plan has been slightly changed. The most potential sell should be considered at the upper border of the current balance, most likely in the format of a false breakout. An alternative scenario, also sell, can be considered at the lower border of the same balance, that is, in the format of a breakdown of the level of 1.32399. The target is still the same at the level of 1.31385.
Thank you for like and share your views!

CRUDEOIL - KeyLevels for next WeekIf you wanna take a trade on Crude Oil, maybe, before that, you need to conisder this KeyLevels of support and resistance areas.
Careful with longs until on daily is still bearish / downtrend
USDCAD-06/30/2023Preferred direction: SELL
Comment: The formed balance at 1.31385 is most likely to be distributed downwards, since market long-positions on this pair cannot move the price upwards. Thus, an impulsive hike down has a good supply of "fuel". The breakdown of the level 1.31385 is just the entry point. The considered target for this deal is at the level of 1.31385.
Thank you for like and share your views!

UKOIL (BRENT)-06/29/2023Preferred direction: BUY
Comment: Oil has been trading in the range of 72.36 - 77.39. The most pleasant entry points are certainly located at the extremes, however, the current price attracts those formed by accumulation. Accumulated selling can well push the price up to the level of 76.30.
Thank you for like and share your views!

Stubborn MarketsThe markets simply refuse to give up. The birds are speaking to them, but nobody listens.
Gold, still living inside a massive bearish wedge pattern, is almost ready to print a death cross.
The 1M, 2M and 3M timeframes print a similar picture.
The 2M chart is beginning to give in. Volatility between MAs is keeping these still glued together, unable to figure out the next move.
Either the best Golden Cross prints or the worst Death is soon to come.
Markets are weird. I always found incredibly interesting the period before the .com bubble.
Equities had just printed a death cross. After the post-1988 prolonged weakness, all support seemed to have been lost. Instead, the markets boomed.
It is at these extremes when the good and bad stuff happens.
I am getting annoyed from all the birds speaking, many of them bullish on gold, others bullish on equities.
The Gold Bird
Everybody wants to keep this fella alive!
The SPX Bird
Everybody wants to kill this poor fella!
With both birds SCREAMING, we cannot reach conclusions.
Gold Bulls are buying into their ultimate doom.
SPX Bears are selling into one of the most powerful bull runs we have witnessed.
It is the duel between them that will clear the picture.
Honestly, it looks like a Gold Cross is about to shape for equities, not for Gold!
Gold may instead take the black death-ish color.
Again, Buffett may be right after all... Japan + Oil = love-4-many-years
US Yield Rates show significant signs of strength.
The end of the 2nd Big Tech bubble is right around the corner...
Bird might be Peter's word. Don't be like Peter.
Remember: Trend is the trader's word.

UKOILThis is an update from the last time we took a trade on oil. Our approach was wrong, impatient and too easy, this time we have gone in with refinement and it has paid off.
- Pressure from the demand was very high
- retest of sensitive area
- break down of strength
- impulsive candle
This is to show that every time you refine your strategy you add to the skill so stay working on it and making it better, it is YOURS so only you can put in the work.

ukoil 1 hour chart distribution tp 65 usd / bbl🔸Today let's review the 1 hour chart for brent oil . Previously strong downtrend in
progress entire 2023 so outlook remains bearish until we can daily close above 80 usd.
🔸OPEC production cuts have low impact on prices recently due to lower global
demand. Technically, we are in a distribution pattern setup since May 2023 and expecting
breakdown and new/fresh lows soon for Brent.
🔸Recommended strategy for crude oil traders: short-sell near market / short-sell rips
and rallies, limited upside and final TP bears is 65 USD. once we get a valid breakdown
of the structure expecting losses to accelerate in this market.
🎁Please hit the like button and
🎁Leave a comment to support our team!
RISK DISCLAIMER:
Trading Futures , Forex, CFDs and Stocks involves a risk of loss.
Please consider carefully if such trading is appropriate for you.
Past performance is not indicative of future results.
Always limit your leverage and use tight stop loss.

UKOIL🤣🤣🤣🤣🤣🤣🤣🤣🤣🤣🤣🤣
Like I said that was just for my notes and to learn, therefore back to the drawing board and more refining of the strategy before we come back.
Clearly the consolidation we saw was not a break of structure but rest before continuation.

UKOILBig risk and I do not advise it. This is something I have been watching from a distance for months, so no I want to try what I have been figuring out with OIL.
I'm only posting because I need it for records and learning material for myself in-case this goes sideways, even when you look the RR is very bad but this is how far my strategy for oil has brought me.

UKOIL(BRENT)-06/19/2023Preferred direction: BUY
Comment: Closing the price above the local resistance 76.30 creates a potential movement for buyers towards 77.39. This will be another major buying hurdle as it is medium term resistance. Given the context of the price movement towards this resistance, there is a very high probability of a breakout to the upside. Perhaps this will not be the biggest upward impulse, however, the approach to the round value of 80 will most likely be provided.
Thank you for like and share your views!

USOIL - NEW BREAKOUT📈Hello Traders👋🏻
The USOIL Price Reached a Major Support Level (68.08 - 66.51)✔
Currently, The Price Reject To Create New Lower Low, The Resistance TrendLine is Broken🔥
So, I Expect a Bullish Move📈
-----------
TARGET: 73.80🎯
___________
if you agreed with this IDEA, please leave a LIKE, SUBSCRIBE or COMMENT!

Crude Oil (WTI): Key Levels to Trade 🛢️
Here is my latest structure analysis for WTI Crude Oil.
Resistance 1: 74.19 - 75.00 area
Resistance 2: 76.60 - 77.00 area
Support 1: 66.84 - 67.30 area
Support 2: 63.58 - 64.00 area
Consider these structures for pullback/breakout trading this week.
❤️Please, support my work with like, thank you!❤️

#Oil Bearish Trend Continues #BlackGoldPrice is trading below resistance. When green support breaks 60s are expected.

#OIL #OOTT UpdateI think I just decoded the oil chart. I have been contemplating a rise to $90+ because I expected ABC flat where I now see WXY combination of zigzag, zigzag and triangle. The chart now perfectly aligns with Brent where wave [ B] did make lowest low presumably shaping a symmetrical triangle whereas WTI is working on a running triangle.
That means that we have only strong push left upwards from current low which should come either as a straight impulse or an expanding diagonal which will be extremely annoying.

Crude Oil (WTI): Time to Buy!!! 🛢️
Crude Oil reached a key daily structure support.
Approaching that, the price formed an ascending triangle formation on 1H time frame.
Its neckline has just been broken.
I expect a pullback.
Goals: 68.6 / 69.4
❤️Please, support my work with like, thank you!❤️
