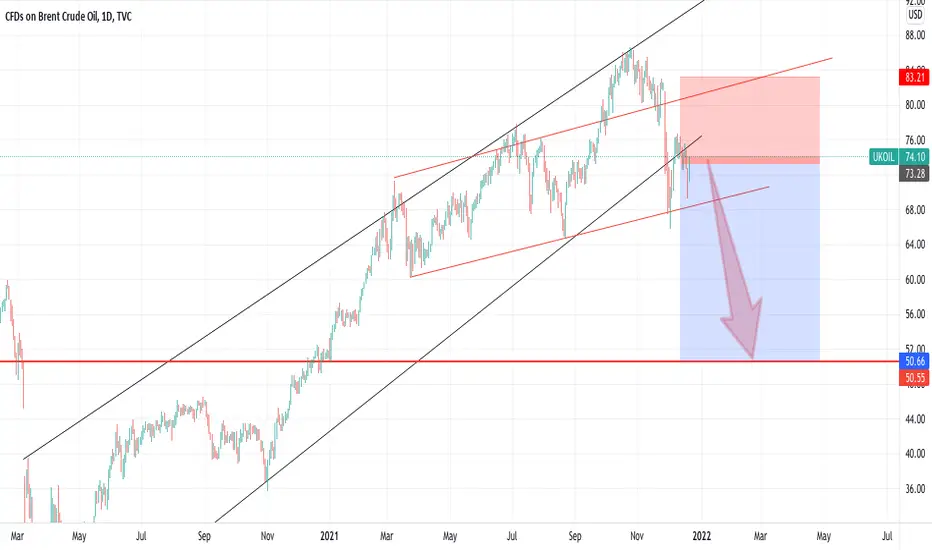
Crude Oil Elliott Wave Idea - UpdateUpdate to below idea
Could be in the final stages of an ABC correction to around the $79 level before Wave Y starts towards $52 level.
Crude Oil Brent

DeGRAM| USDCAD continues to fallThe US dollar is under pressure from the Canadian dollar as well. In principle, all major currencies are putting pressure on the US currency. The USDCAD currency pair is likely to continue its fall from the level of 1.28371. The target remains at 1.27283.
-------------------
Share your opinion in the comments and support the idea with Like.
Thanks for your support!

UKOILSPOT is on bearish momentum! | 24 Dec 2021Prices are at closing near our pivot which is an area of Fibonacci confluences. As the daily chart show strong bearish momentum, we see a potential sell entry at 77.51 which is an area of Fibonacci confluences towards our Take Profit at 72.76 in line with 61.8% Fibonacci retracement and 78.6% Fibonacci extension. RSI is at a level where dips previously occurred.
Any opinions, news, research, analyses, prices, other information, or links to third-party sites contained on this website are provided on an "as-is" basis, as general market commentary, and do not constitute investment advice. The market commentary has not been prepared in accordance with legal requirements designed to promote the independence of investment research, and it is therefore not subject to any prohibition on dealing ahead of dissemination. Although this commentary is not produced by an independent source, FXCM takes all sufficient steps to eliminate or prevent any conflicts of interest arising out of the production and dissemination of this communication. The employees of FXCM commit to acting in the clients' best interests and represent their views without misleading, deceiving, or otherwise impairing the clients' ability to make informed investment decisions. For more information about the FXCM's internal organizational and administrative arrangements for the prevention of conflicts, please refer to the Firms' Managing Conflicts Policy. Please ensure that you read and understand our Full Disclaimer and Liability provision concerning the foregoing Information, which can be accessed on the website.

UKOILSPOT is on bearish momentum! | 23 Dec 2021Prices are on bearish momentum. We see the potential for a reaction at our sell entry at 76.14 which is an area of Fibonacci confluences towards our Take Profit at 72.76 in line with 50% and 61.8% Fibonacci retracement. Technical indicators are showing bearish momentum and RSI are at a level where dips previously occurred.
Any opinions, news, research, analyses, prices, other information, or links to third-party sites contained on this website are provided on an "as-is" basis, as general market commentary, and do not constitute investment advice. The market commentary has not been prepared in accordance with legal requirements designed to promote the independence of investment research, and it is therefore not subject to any prohibition on dealing ahead of dissemination. Although this commentary is not produced by an independent source, FXCM takes all sufficient steps to eliminate or prevent any conflicts of interest arising out of the production and dissemination of this communication. The employees of FXCM commit to acting in the clients' best interests and represent their views without misleading, deceiving, or otherwise impairing the clients' ability to make informed investment decisions. For more information about the FXCM's internal organizational and administrative arrangements for the prevention of conflicts, please refer to the Firms' Managing Conflicts Policy. Please ensure that you read and understand our Full Disclaimer and Liability provision concerning the foregoing Information, which can be accessed on the website.

CRUDE OIL - Purple War Zone!CRUDE OIL is overall bullish trading inside our brown rising broadening wedge and now approaching the lower brown trendline acting as non-horizontal support, we will be looking for Trend-Following Buy setups.
Moreover, the 66.0 is a strong support zone.
So the highlighted purple circle is a strong area to look for buy setups as it is the intersection of the blue support and lower brown trendline.
As per my trading style:
I will be looking for a bullish reversal setup. For example, we have a trendline formed on H4 and we are waiting for the buyers to prove control by breaking above the last high in gray.
Always follow your trading plan regarding entry, risk management, and trade management.
Good luck!
All Strategies Are Good; If Managed Properly!
~Rich

UKOIL need a little correctionIn order for the price to go further - up, a small correction is needed, at least to the central line of the wedge

UKOILSPOT bearish continuation! | 22 Dec 2021Prices are on bearish momentum and abiding by our descending trendline. We see potential for a dip from our sell entry at 74.1 in line with 161.8% Fibonacci projection and 61.8% Fibonacci retracement towards our Take Profit at 71.25 in line with 61.8% Fibonacci retracement. Technical indicators are showing bearish momentum.
Any opinions, news, research, analyses, prices, other information, or links to third-party sites contained on this website are provided on an "as-is" basis, as general market commentary, and do not constitute investment advice. The market commentary has not been prepared in accordance with legal requirements designed to promote the independence of investment research, and it is therefore not subject to any prohibition on dealing ahead of dissemination. Although this commentary is not produced by an independent source, FXCM takes all sufficient steps to eliminate or prevent any conflicts of interest arising out of the production and dissemination of this communication. The employees of FXCM commit to acting in the clients' best interests and represent their views without misleading, deceiving, or otherwise impairing the clients' ability to make informed investment decisions. For more information about the FXCM's internal organizational and administrative arrangements for the prevention of conflicts, please refer to the Firms' Managing Conflicts Policy. Please ensure that you read and understand our Full Disclaimer and Liability provision concerning the foregoing Information, which can be accessed on the website.

CRUDE OIL (WTI) Technical Analysis & Your Trading Plan 🛢
Top-down analysis on WTI.
Structure analysis & key level.
Trading recommendations & thoughts.
❤️Please, support this idea with like and comment!❤️

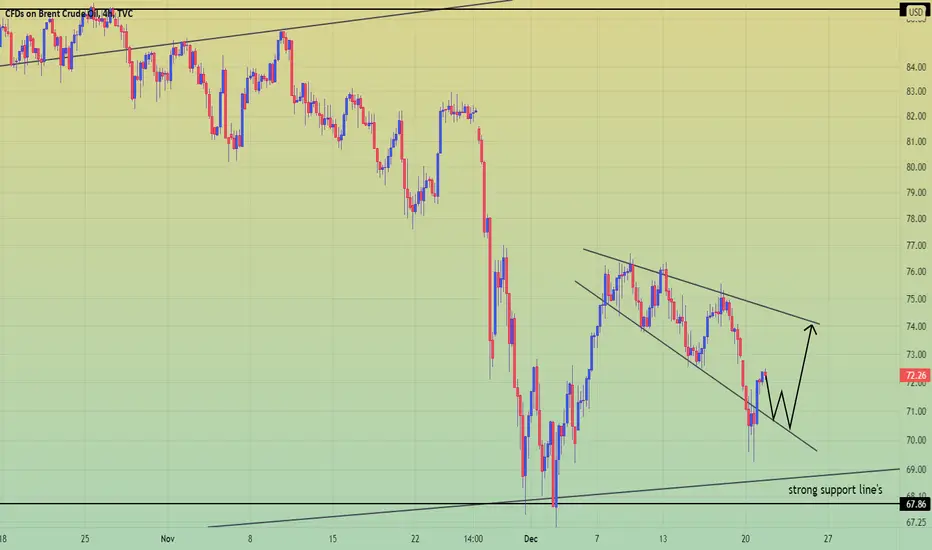
BRENT upward reversal soonOil moves in a downtrend for the second month. There may be a slight rollback to the support line, which coincides with the lower border of the wedge, also support. Although each high is lower than the previous one, this will not prevent us from reversing the trend up.
$UKOIL $WTI Looking For Short Opportunities - Patterns EvolvingTraders, I trade UKOIL (Brent) mainly because of GBP factor but this idea can be applied to USOIL (WTI) as well. There is a head and shoulders pattern on Brent but there is a gap left too. Gap is present right at the completion of a W pattern which can give us very good short opportunity. If the market does not go up there to complete the W pattern then break and confirmation of the neck line break will give us good short opportunity.
Markets can be very fragile in these last days of the year so be careful.
Rules:
1. Never trade too much
2. Never trade without a confirmation
3. Never rely on signals, do your own analysis and research too
✅ If you found this idea useful, hit the like button, subscribe and share it in other trading forums.
✅ Follow me for future ideas, trade set ups and the updates of this analysis
✅ Don't hesitate to share your ideas, comments, opinions and questions.
Take care and trade well
-Vik
____________________________________________________
📌 DISCLAIMER
The content on this analysis is subject to change at any time without notice, and is provided for the sole purpose of education only.
Not a financial advice or signal. Please make your own independent investment decisions.
____________________________________________________

UK Brent Crude Oil Analysis So, I will start with the basic Chart layout and then will continue to dive deeper in to the Analysis.
The Chart is as you can see in a downtrend. And not just on a short time frame (1-5m) also on a bigger one (1h)
The S/R level changed that means that we are on a new Trend level.
At this point UKOIL has no more in the same price movement then the USOIL As you can take out of my USOIL Analysis linked below
But still, the EW gives us a nice 0WXVXZ Pattern but in a triangular figure going downwards
The Purple Ellipse shows us a failed repriceing on the failed reversed head and shoulders located between (W) and the Purple Ellipse
Fib:
I applied the same fib i was using on my WTI analysis and as it shows out we got 3 interesting hit points
The Purple Ellipse is like i said before a failed repricing for the failed HS
No.1 is located at the 0.7 fib lvl.
No.2 is located at the 1.0 fib lvl.
No.3 is located with the closed body wick at the 0.7 fib lvl.
well if you take a look at the chart you can see that the 0.5 fib lvl. is the strongest testet fib lvl.
Now the Indicator Part:
I used the CCI and The WaveTrend Indicator with crosses by LazyBear
I numbered every type of movement in the chart
As i explained before the S/R level has changed thats why i numbered it 1 and 2
The green Ellipses on the Chart windows are the Buy areas after the Indicators that i was using
1. CCI
The CCI shows us that we are currently in a Oversold area this means that the Price will recover from the little downtrend
2. WaveTrend Indicator
This one is also used to identify Oversold and Overbought areas And like before we are Oversold
We are on the green line this means that the prise will pop up agin.
The WT sequence was perfectly 2 times tested
So If 2 indicators practically match with one signal i will strongly consider to take a look at some buy/ sell option
I will keep you guys updated whats happening with WTI(US) and Brent(UK) Oil!
Tell me what you think about this!
Well this was the end
I hope all of you liked it and do not forget to leave a review below :)
TVC:UKOIL
TVC:USOIL

CRUDE OIL (WTI) Key Levels to Watch 🛢
Hey traders,
A lot of questions about WTI Oil.
The market still looks very bullish to me.
Here are the key levels for you to look for trend-following / counter-trend trades.
For trend following opportunities watch:
Support 1: 61.2 - 62.6
Support 2: 57.0 - 58.3
For counter-trend opportunities watch:
Resistance 1: 74.6 - 76.0
Resistance 2: 78.0 - 79.5
Resistance 3: 84.8 - 86.0
Resistance 4: Major rising trend line
Once one of the key levels is reached, look for the intraday confirmation before you open a trading position.
❤️Please, support this idea with like and comment!❤️


UKOIL longthe price returns to the channel and if it bounces off the support, the next goal will be resistance at the level of 77.00 and then higher

Cude oil Trend and Wave AnalysisCrude oil chart. My view of this chart is that it is creating an abc flat structure and is currently in wave c. This wave will grow in the form of 5 waves.
ukoil ... usoil ... wtioil ... opecoil
The wave you see in the future price on the chart is a schematic of a possible price trend and will not be formed just to clarify the possible price movement.
This is a personal analysis and should not be considered a criterion for buying or selling. Please pay attention the take profit and stop loss.
Nemodar naft kham va tashkil sakhtar abc flat ke pishbini mishe ta target taeen shode roye chart ghemat dar Ayande roshd kone ke mishe azash dar tahlil joft arzhaye commodity azash estefade kard

Crude Oil Elliott Wave Idea - UpdateAn update on below idea:
Oil hit the 0.382 extension exactly around $84,07 and has since fallen sharply.
In my opinion this is the start of the correction of the move up from the lows in April 2020 to the highs in October 2021 which could end in the $50 to $58 area.
Just theorizing here that we're currently in the middle of wave 3 of A where A would complete around $61 before a correction before proceeding down towards that $50-$58 level.

UKOIL growth from support to 73.6The price renewed the local minimum, having made a false breakdown, rolled back and returned to a long zone relative to the support level. I am waiting for the consolidation above the level of 70.67 and the price recovery to the resistance of 73.62
Traders, if you like this idea or have your own opinion about it, write in the comments. I will be glad👩💻

Technical analysis update: USOIL/WTI oil (30th November 2021)In our previous idea we noted that we saw short-term and medium-term headwinds for further rise in the price of oil due to ongoing politics between the U.S. and OPEC. We also stated that we expected the OPEC to take countermeasures in response to release of strategic oil reserves by the U.S. and its allies. We await tomorrow's OPEC meeting (and with it more insight into the mentioned countermeasures) which we expect to bolster the bullish case for oil in the long-term. We expect these measures to come in the form of less production quotas for cartel members.
Price of USOIL fell over 21% within the last 36 days. At the moment, technical indicators point to oversold conditions in the oil markets. We think that the current price is extremely attractive for a long position (re)entry. However, we are very cautious as it is possible that the U.S. and its allies will take actions to offset measures taken by the OPEC. If this is to happen, then we expect the price to continue lower towards 65 USD per barrel.
Technical analysis - daily time frame
RSI is oversold. MACD continues to develop bearish structure with no signs of flattening. Stochastic is also bearish. DM+ and DM- indicate a bearish trend with ADX suggesting its strengthening. Overall daily time frame is very bearish. However, some indicators reached an oversold condition already which suggests that end of correction might be in sight. Though, all depends on further measures by the U.S. and OPEC.
Technical analysis - weekly time frame
RSI is bearish. Similarly, Stochastic and MACD are also bearish. DM+ and DM- show bearish condition, however, ADX continues to decline which suggests that trend of higher degree is weakening. It is possible that the price will move in range for a while before a new trend will begin.
Support and resistance
Major resistance level sits at 85.39 USD while the major support level sits at 61.58 USD. Short-term resistance appears at 69.60 USD. Resistance 1 is at 74.21 USD, Resistance 2 is at 75.47 USD and then Resistance 3 is at 76.95 USD. Strong support also appears at 65 USD from a psychological standpoint.
DISCLAIMER: This analysis is not intended to encourage any buying or selling of any particular securities. Furthermore, it should not serve as basis for taking any trade action by individual investor. Your own due dilligence is highly advised before entering trade.


CRUDE OIL (WTI) Key Support Ahead! Your Plan: 🛢
Update for WTI Oil.
As you remember we spotted a major expanding wedge pattern on a daily time frame.
Now the price is approaching its lower boundary.
Taking into consideration that the market is trading in a long term bullish trend,
I am looking for buying opportunities at the moment.
My confirmation to buy will be a bullish breakout of a falling parallel channel on an hourly time frame.
Then the price will most likely grow at least to 72.0 level.
In case of a bearish breakout of a blue potential reversal zone,
the setup will be invalid.
❤️Please, support this idea with like and comment!❤️

A continuous short trend for BRENT OIL!At the end of the last week and after the sudden emersion of omicron coronavirus, the price of oil faced a dramatic decrease! In the beginning of this week, after a slight consolidation upward, it has fallen even more dipper than the point which was closed previous week.
Right now in this position I guess that the upward correction is about to finish and in minimum case the fall to its last area is possible.
