Brent: new recordsAnd so, oil continues to set new records against the background of continuing demand. Many respected financial institutions predict price increases in the future. At least they would remain at current levels.
Remember, there is no place for luck in trading - only strategy!
Thanks for the likes and comments.
Crude Oil Brent


Brent: forecast for Oct 11 - Oct 15Prospects for oil prices, to a greater extent, would add up to their growth or at least consolidation in the range of ~ $ 78–82. Deficit reduction is progressing more slowly than planned. The oil market is still in deficit, but not as before in view of the beginning of a small, but still consistent, softening of quotas by OPEC +. The decision by OPEC and its allies (OPEC +) on Monday to maintain the planned increase in oil production was prompted by fears that demand and prices could weaken.
Their fears are not without reason. The current oil and gas trend indicates a likely decline in the near term. The almost vertical takeoff of gas and coal quotations, and more recently oil prices, can hardly be considered sustainable. Such market movements are more likely to end in decline than in further growth.
With such sharp price surges as now, investors and traders should be prepared for verbal interventions by the buying and exporting countries. One of these statements was made by Iraqi oil minister (about a fair price for oil in the range of $ 75-80). In addition, it is very likely that the United States, China and India will try to stabilize the situation in their markets.
Also, we must not forget about the daily pressure on oil from alternative energy. On the long-term horizon, the fall in demand looms more and more due to the energy transition. This is a strong incentive to ramp up oil and gas production now in order to invest revenues in the future.
In general, prices are expected to roll back to the level of ~ $ 78.90 for the coming week.

USDRUB: time for upward correctionAnd so, quite well recently, the Ruble has won back positions against the US dollar. It's high time for upward correction. The instrument is expected to move up to the level of 72.68. Some resistance is located at 72.265. Additional pressure on the Ruble would come from the expected downtrend movement in oil in the short term.
Remember, there is no place for luck in trading - only strategy!
Thanks for the likes and comments.

BTCUSD: forecast for Oct 11 - Oct 17Bitcoin is trading at 54,000. At the moment, everything indicates the presence of a bullish trend for the instrument.
As part of the BTCUSD rate forecast, a test of the price range area 50.406 - 52.966 (support area) is expected. Where can we expect an attempt to continue the growth of the instrument and the further development of the upward trend. The target of this movement is the level of 60,000. A small stop in the form of a resistance level is located at the level of 55832.57, and there is hardly any need to expect much resistance here.
Cancellation of the option to continue the growth of the Bitcoin rate would be a complete breakdown of the support area 50.406 - 52.966, although consolidation in this area will not benefit buyers.
In general, it is expected to rise to the level of 60,000 with small pullbacks down.


Brent: countertrend dealThe decision by OPEC and OPEC + on Monday to keep the plan for a gradual increase in oil production was prompted by fears that demand and prices could weaken.
The group also considered the possibility of increasing production by 800,000 barrels per day, which is almost 1% of global production, ahead of Monday's meeting.
Now the OPEC countries are more cautious, because any hasty decision could lead to a sharp drop in oil prices.
In the medium term, the instrument will be on the rise.
Today is rich in news. Taking into account this fact, as well as the strong upward movement in oil, no one canceled short-term sales for the instrument.
Proposed deal for this tool:
Entry Point - 82.85
Stop Loss - 83.80
Take Profit - 82.08

Crude Oil (WTI): Key Levels to Watch 🛢️
Hey traders,
Contemplating this bullish rally on WTI,
here are the major key level to watch for pullbacks.
77.0 - is the structure resistance that went broken this week.
Now it turned into a support
91.0 is a minor monthly/weekly resistance.
The price may retrace from that.
107.0 - 115.0 is a major monthly resistance cluster.
A strong bearish reaction will be expected from that.
Be prepared for a bullish continuation.
Try to catch it on an occasional pullback.
❤️Please, support this idea with like and comment!❤️

USDCAD: in the trade balanceAnd so, the Canadian is also in anticipation of today's events during the American session. It is expected that the pair may sink at the moment, but it is unlikely to fall below 1.24911 (even more likely it would not reach and go up). The combination of technical and fundamental facts suggests that the instrument would move up in the medium term within the trade balance 1.24911 - 1.28962.
Remember, there is no place for luck in trading - only strategy!
Thanks for the likes and comments.

Brent: dollar would force correctionThe oil is supported by reports that Saudi Arabia lowered its November export oil prices for Asia, the Mediterranean countries, Europe and the United States.
Also, a positive factor for the oil market in recent days was the decision of the OPEC + states to maintain the previously adopted plan to increase oil production, despite the growth in demand amid a sharp rise in the cost of natural gas.
In accordance with this plan, OPEC + countries will increase oil production in November by 400 thousand barrels per day.
Meanwhile, data from the American Petroleum Institute (API) indicated an increase in US oil inventories by 951 thousand barrels for the week ended October 1, while analysts predicted an average rise of 4.127 million barrels.
Further oil situation will directly depend on the dynamics of the US dollar. The oil itself, most likely, needs a correction, and if the dollar is not weak, this is possible.
Proposed deal for this tool:
Entry Point - 82.59 (SELL-Limit)
Stop Loss - 83.45
Take Profit - 81.73

UKOIL facing bearish pressure, drop incoming!UKOIL is approaching the upper resistance of the ascending price channel in line with 1st resistance at 83.09 in line with Horizontal swing high and 78.6% Fibonacci extension. Price is likely to reverse off from 1st resistance at 83.09 in line with Horizontal swing high and 78.6% Fibonacci extension to take 1st support at 78.80 in line with 61.8% Fibonacci retracement and 100% Fibonacci extension level. Our bearish bias is further supported by how RSI is showing a negative bearish divergence. Otherwise price may bullish towards 2nd resistance at 85.04 in line with -27.2% Fibonacci retracement and 127.2% Fibonacci extension.
Trading CFDs on margin carries high risk. Losses can exceed the initial investment so please ensure you fully understand the risks.

Crude Oil Elliott Wave IdeaWorking in the oil & gas industry I've always wanted to plot an Elliott Wave idea with oil reaching $100, one that I felt was realistic and not pie in the sky...in my opinion oil is heading that direction now.
The exact 0.382 retracement level from $44,05 to $33,79 at the end of 2020 leads me to believe that was the end of wave 2 and the next retracement will begin at the 1.618 level around $77 for wave 4, before wave 5 towards $100.
I had a similar idea back when this move from $33 started () that this move could be wave 5 but its flown far beyond those levels and has me thinking this is wave 3 we are in now, and its not quite finished yet.

Crude Oil - experiment !Hy trader !
This Crude Oil weekly chart is a combination of 2 Fib Circles ,Time Cycles, Sine Line and Fib retracement !
No trading advice !
If you like this post smash the like👍 button, comment or follow me.
Thanks for reading my idea,
Trade save!!

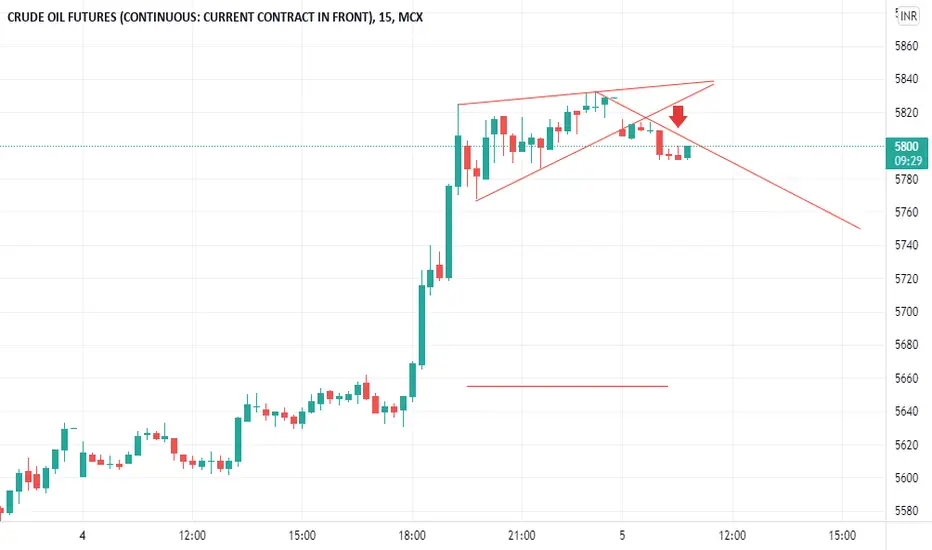
MCX CRUDEOILMarket Over bought .Market Down For at The Level SELL -
5800-5810 .I Think Market Down ..Comment Your Opinion
Crude Oil Elliott Wave Idea - UpdateAn update on these ideas from March 2021:
It appears that wave 4 is complete close to the 0.382 level and the next move could be wave 5 up towards the $90 level.

OIL Intraday. Aiming 1:10 RRRisk 1% and aiming for 10% on this trade. No indicators used. Pure price action. Like to keep my chart clean.
All trades closed on the same day. Entries on 1 min chart
Mostly trade 12-5pm UK time NY session. Sometimes London Session. Don't like the idea of watching charts the whole day.
