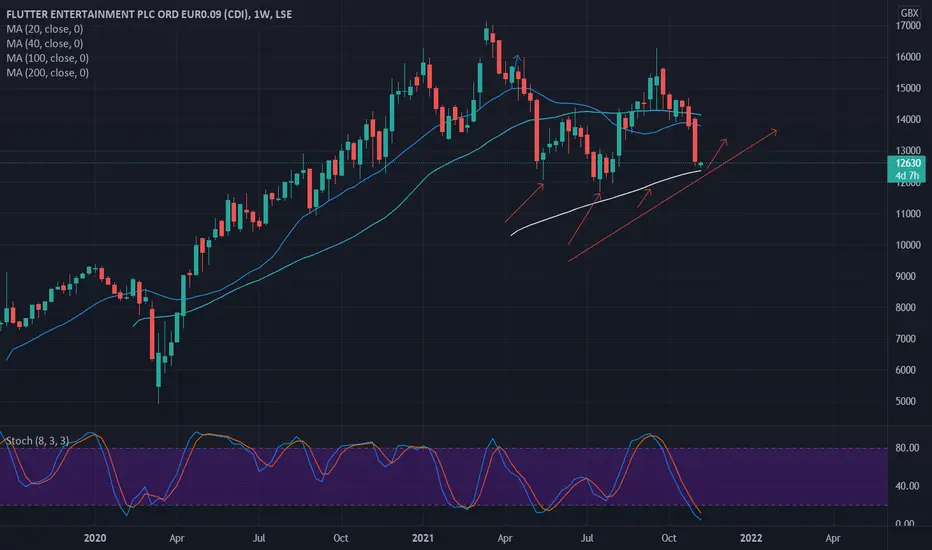
FLTR.. A Great Long to take.FLTR has risen greatly after the pandemic, growing to new heights quickly.
We have now had our dip back to support and are looking to take this long.
Strong Technicals Combined with strong fundamentals make FLTR an excellent long trade to take.
Now is a good time to buy your shares in FLTR as we see a move back up to the highs.
Ukstocks
NCC set for a rebound?LSE:NCC
Is the sell off here warranted? I am not so sure as there are 2 diverging activities here.
Initially from the 13th of September, the fall was looking justified with increasing volume on any new lower candles.
Yet this last candle has produced one of the highest volume days yet, trading within a smaller range than previously.
So I am now seeing increasing volume, on shorter bodied selling candles, telling me buyers are absorbing all the sell orders the market can throw at it.
Looks like a change in sentiment and this will go on my buy list for Monday.

FTSE 100 1-day classic patternsWhat has the highest probability of occurring?
Since early May 2021 price has rotated from 7200 resistance to 6800 support and back again on 2 occasions.
There are two classic patterns forming within these rotations.
The broadening top is currently valid with 3 tests of the upper trendline. The recent rejection at 7200 appears to be what Bulkowski describes as a partial decline having tested the 50% fib retracement.
This projects a target of 7700.
There is also a triple top that would need to test 6800 support again to become valid.
Further a breakout from the triple top projects a target of 6350, the low of the year. This would fulfil the tape chatter of "a healthy 10% correction".
N.B. these patterns are forming over a 4-month period. It is probable that the eventual outcome will be a powerful move.
Objectively the triple top is not confirmed until a test of 6800 has occurred. So the bias is long in the framework of the broadening top. Given the partial decline it is probable that market participants are already getting long. The long trade is invalidated once price touches the lower trend, validating the triple top. Using 6800 as a stop loss from current levels yields 2R to 7700. If this is too large a stop classic patterns on a lower timeframe should be employed to fine tune stop placement.

FTSE 100 ExpirationQ: What has the highest probability of occurring?
There is a lot of volume being traded but the market is moving sideways. The expiration date on the 3rd Friday of the 3rd quarter is approaching. Traders are rolling forward their contracts from September to December.
It makes for quite difficult trading of classic patterns. A rise in false breakouts.
Consider where the future price is relative to the spot price of the instrument being traded.
Is it higher or lower? Since futures contracts expire at the spot price that mean the futures price is more likely to move down or up to the spot price.
Since algo's trade the arbitrage here there is not a great spread between the two prices although it would make sense to trade in the direction of the spot price.
As expiration nears the distribution in the spread is more likely to be normal. This suggests the market is more inclined to mean revert. Think Bollinger Bands and rotations between the standard deviations.
Its not clear cut, there are losers and winners B for Buy and S for Sell. Higher timeframe Bollinger Bands also play a role in where price stops.
The logic behind this is that traders need prices to stabilise so they can execute like for like between the expiring contract and future contract.

Begbies Traynor LSE - Classic Cup and Handle on daily chart Hi everyone,
Just giving a quick analysis on one of the AIM-listed stocks on the LSE (London/UK). As you can see, there is a clear cup and handle forming on the daily chart, and it is an incredibly clean example in reference to what you would technically find in a text book. The resistance is at 115p, and this week it has seen a breach above next to the 120p level.
The company itself is also fairly good on the fundamental side - its latest fundraising (secondary offering to help finance another acquisition) was recently oversubscribed and the placing price was above market price, which the share price higher from 105p to 115p. As it is seemingly breaking resistance now, the question is about whether there will be a retest of the 115p level, or whether it will continue above 120p and onwards. Canaccord currently has a 170p price target on the stock, as issued earlier in March. The cup and handle may signify a strong climb as the UK eases lockdown. Another buying opportunity would be in the case where the price will fall to the lower red upwards trendline, which seems to be a good support for the price.
Disclaimer: I hold BEG at 105p average. Please do not take as professional financial advice. Always do your DD. Thanks!

FTSE Has Completed RetraceThis has retraced as expected to previous resistance and 0.5 Fibonacci. I will be waiting to see how this develops before entering a long as this could drop further, watch for the EMA's to cross back over or come very close to. If the price does hold this level then a target TP can be 7031.

Rolls Royce - Do Not Miss The Big Opportunity in RRThis is at strong support both technically and psychologically as it is at £1. I do not expect this to drop anymore from here, if it does then a quick bounce back should be expected as can be seen on the 21st December 2020. I have set TP at the previous high of 146.45 and then another target at 164 if it breaks the previous high.

Dunelm Group Plc....UK Share To Keep an EYE On. At Supply Level
2 October 2020
Bearish Outlook.
Dunelm Group Plc.
UK Share To Keep an EYE On.
Dunelm Limited is a British home furnishings retailer.
Weekly Price is
Over Extended
and is @ a Strong
Supply Level.
If ???? Close above the
Current high of 1563
Price could go much HIGHER
LSE:DNLM

ASTON MARTIN BREAKOUTDont post stock often on here, but aston martin looks like it wants to break out of the squeezing pattern and make some ground, good chance for a high percent trade here.

$GAN can rise in the next daysContextual immersion trading strategy idea.
GAN Limited provides enterprise Software-as-a-Service solutions for online casino gaming and online sports betting applications.
The share price rose after good earnings. I see some preconditions the share price will continue growing.
The demand for shares of the company still looks higher than the supply.
These and other conditions can cause a rise in the share price in the next days.
So I opened a long position from $23,30;
stop-loss — $20,05.
Information about take-profits will be later.
Do not view this idea as a recommendation for trading or investing. It is published only to introduce my own vision.
Always do your own analysis before making deals. When you use any materials, do not rely on blind trust.
You should remember that isolated deals do not give systematic profit, so trade/invest using a developed strategy.
If you like my content, you can subscribe to the news and receive my fresh ideas.
Thanks for being with me!

FTSE 100 - Top of the shop?Short sellers squeezed out?
Head and shoulders top forming?
I personally like speculating on what I think could be a right shoulder in a head and shoulders top pattern. Especially when the (potential) right shoulder squeezes into a 78.6% Fibonacci retracement level.
Selling FTSE between 5860-5877 if I can. Stops above the highs.
The measured move target is at 5110.

Morgan Advanced Materials (MGAM) - Continue higher expected.Buy Morgan Advanced Materials (MGAM.L)
Morgan Advanced Materials plc, formerly The Morgan Crucible Company plc, is a United Kingdom-based engineering company. The Company is engaged in advanced materials science and engineering of ceramics, carbon and composites. The Company's segments include North America, Europe and Asia/Rest of World.
Market Cap: £889.21 Million
Morgan Advanced Materials broke out of a bottom pattern back in November 2019 above 283p and the price went on to reach 339p very quickly. We have seen some evidence of the price begin to consolidate within a flag/pennant pattern. The shares appear to be on the verge of completing the pattern, which should lead to a continuation higher over the short to medium term. The ultimate target is at 424p, which is roughly 35% higher than the current price.
Stop: 292p
Target 1: 365p
Target 2: 400p
Target 3: 424p

Fresnillo - LONGLong opportunities continue to present themselves while this technical standpoint continues to play out. Sized in from the bottom and looking to sit on my hands to take profit at key levels on the chart. Trade with care.
Note: This idea follows my own tried and testing trading strategy and rules. This idea does not constitute trading guidance for anyone else.
DM to learn more about learning to trade.

BT Group - Filled the gapBuy BT Group (BT.A.L)
BT Group plc is a communications services company. The Company is engaged in selling fixed-voice services, broadband, mobile and television products and services, as well as various communications services ranging from phone and broadband to managed networked information technology (IT) solutions and cyber security protection.
Market Cap: £18.96Billion
BT has broken out of a channel pattern on the daily chart. The shares recieved a boost following the Conservative win in the General Election and the shares gapped higher. We have now seen that gap get filled, which should attract fresh buying interest.
Stop: 181.6p
Target 1: 212p
Target 2: 230p
Target 3: 265p

200% spike on 14x average volume!Eurasia Mining has spiked over 200% on almost 14x average volume. This is a huge move with a lot of momentum behind it. That being said, there is likely a lot of profit taking to come.
The market has strong potential resistance at 1980-2005. Will it be strong enough to trigger a reversal? Maybe. It is the confluence of two 1.618 Fibonacci projections. If the market reaches that level this week, as it is close to doing, it will also coincide with a 0.75 Speed fan trend line. This stock has a history of being spikey. Watch out, it can fall through the floor very quickly.

FTSE100: Double Buy Target.The index has broken above both the 1D MA50 and MA200 this week and 1D turned bullish (RSI = 57.795, MACD = 3.690, Highs/Lows = 85.3366) towards the 7,440 Resistance. It appears to be repeating the April - July sequence, currently being at the start of the final (and most aggressive) bullish leg. The obvious short term target is the 7,440 Resistance but in our opinion, and with the 1D RSI potential, if the 1D candle that breaks the Resistance closes above that level, we can extend the uptrend as high as 7,620.
** If you like our free content follow our profile (www.tradingview.com) to get more daily ideas. **
Comments and likes are greatly appreciated.

Jubilee Metals - Speculative longJubilee Metals has corrected lower in recent weeks to retest the breakout level of 2.80p and slightly below this at the 61.8% Fibonacci support level. The large reversal today is an encouraging sign which the shares set to close above the 10EMA. It’s also been noted that trading volume has been consistently above 50k for the past 90 days. It looks an interesting level to accumulate.
Target: 3.74p
Stop: 2.55p

IAG - About to flyBuy IAG (IAG.L)
International Consolidated Airlines Group, S.A. is an airline company that holds the interests in airline and ancillary operations. Its segments include British Airways, Iberia, Vueling, Aer Lingus and Other Group companies. It combines the airlines in the United Kingdom, Spain and Ireland. It has approximately 550 aircrafts to over 280 destinations. The Company operates various aircraft fleet services, including Airbus A318, Airbus A319, Airbus A340-600, Boeing 787-800, Embraer E190 and Boeing 777-200, among others. The Company, through its subsidiaries, is engaged in providing airline marketing, airline operations, insurance, aircraft maintenance, storage and custody services, air freight operations and cargo transport services.
Market Cap: £9.25Billion
International Consolidated Airlines share price has been hit hard over recent months. Following the sharp move lower we are now beginning to see the shares consolidate and potentially forming a bottom pattern. A break above the resistance at 4878p would confirm the bottom pattern and offer upside potential towards 560p. In extension of that, there is an unfilled gap at 643p, which may act as a magnet for the price over the medium term. The risk/reward is favourable from here.
Stop: 432p
Target 1: 560p
Target 2: 605p
Target 3: 640p
Interested in UK Stocks?
Join our free Telegram channel for up to date analysis on the best main market opportunities in the UK right now - t.me

Bango - More upside expectedBuy Bango (BGO.L)
Bango PLC (Bango) offers the Bango mobile payment platform. The Company's principal activity is the development, marketing and sale of technology to enable mobile phone users to make payments for digital content and media on smartphones and tablets. The Company's segments include End user activity and Platform fees. The End user activity segment includes the content access fees paid by end users for accessing chargeable content provided by digital merchants, adjusted to take account of whether Bango is agent or principal in the transactions.
Market Cap: £94.28Million
Bango has formed a bottom pattern on the daily chart. The double bottom completed on the move above resistance at 130p. The shares have been in consolidation mode in recent weeks but now look set to head higher over the short to medium term. We have major resistance around 198.5p, which also lines up with the 61.8% Fibonacci resistance level at 192.5p. We expect to see the short term sequence of higher highs and higher lows continue.
Stop: 115p
Target: 192.5p
Interested in UK Small Caps?
Join our free Telegram channel for up to date analysis on the best small-cap opportunities in the UK right now.
t.me

Vodafone Reversing??Vodafone ran into a solid confluence zone of resistance in Friday. It has since retraced over 5%. Today it fell over 2.3% and, crucially, it fell below the 1:1 trendline on the Fibonacci Fan shown. This is important because this trendline has acted as the greatest source of support throughout this uptrend. In addition, there has been a bearish divergence on the RSI since August 21st. The resistance was also provided by a 1.618 extension of the range between points A and B (not shown).
As far as targetting how far the market MAY go, the strength of resistance indicates there's a good chance the market will retrace to the 0.382 level or more. Note that this is one of the strongest horizontal price barriers on this chart. If the market reaches the 0.382 level, it could do so at a point of intersection with another diagonal price barrier such as the example in the pink circle where the 0.75 fan line intersects the 0.382 level.
Equally, breaking through this level to the downside would be a sign of strength in the downward pressure. If the market reaches this level, watch how the price behaves around the level. It will leave very important clues.

Confluence of resistance for RBSFor a more in-depth analysis, see:
www.quantiumresearch.co.uk
RBS ran into an almighty price barrier on Friday. Today it reversed over 2%. Look at the significance of this resistance. 3 components are shown in the chart:
1) Fibonacci fan line
2) 100-day moving average
3) 2.618 extension of a price gap.
The market has retested and responded to the 0.382 trendline from the fan 3 times before now. That makes it a validated trendline and solid resistance in its own right. When this was combined with the 100-day moving average, it gained even more significance. Now, the Fibonacci extension is measured not from a price range, but from a non-price range: a gap! The high of the top candle landed right on the 2.618 extension. This degree of confluence means something.
That being said, the market had completed 5 waves down and developed a bullish divergence on the RSI . If this means the downtrend is over, then today's turn to the downside may be short lived, even it it was initiated by a very strong area of resistance. A very interesting chart to keep an eye on.

IHG - Retest of the breakout and 38.2% Fibonacci support.IHG is trading in a strong long term uptrend. The shares have corrected lower in recent weeks but buying support has been found at the previous break out level, which is now support. The correction is also inline with a 38.2% Fibonacci support level adding further weight to the bullish argument. Further upside is expected over the short to medium term.
