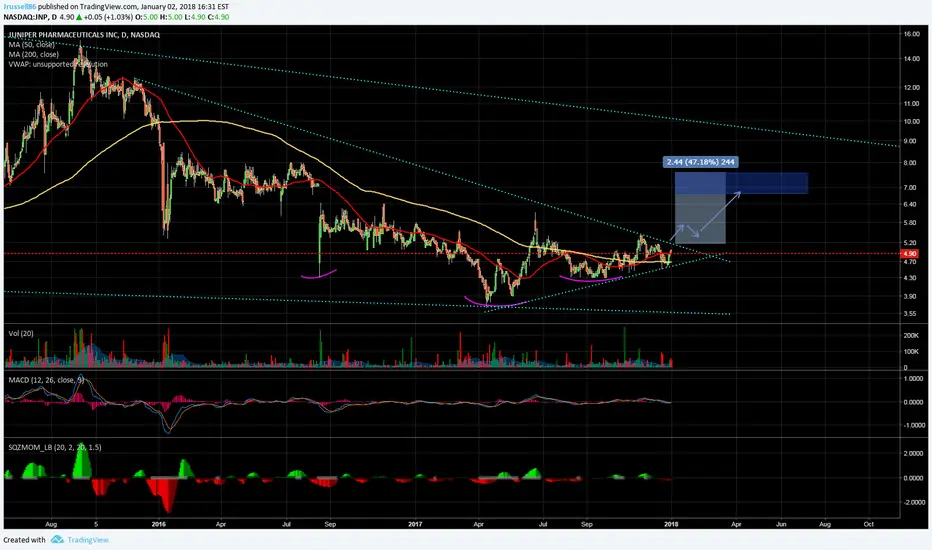
Symmetrical TriangleMeasuring rule implies 47% increase, initial PT: 6.7. Gurufocus' DCF fair value= 6.4, a 24% Margin of Safety. Decreasing debt, increasing cash & undervalued!
Undervalued

XLM (Lumen) UNDER VALUED WITH WEEKLY POTENTIAL (30-45%)Disclaimer : Anything that I say is my own opinion. I have been doing my own personal research and believe that Lumen (XLM) is an excellent investment. After following it for a few weeks I made a small investment. Any money that you invest is your responsibility. Do some research and learn about the currency yourself before putting your hard earned money into it. This is not a "pump and dump" , it is a just friendly investor sharing his insights.
Like I said earlier, I believe that XLM is a great investment. It is relatively cheap (i.e 21 cents right now) and is showing HUGE potential.
I am planning on holding this investment for only a week, seeing the potential for weekly to be around 35-45%.
So lets get started!
***I personally use Ethereum to do my transactions/transfers to altcoins. If you use BTC then your graph may look slightly different. Keep that in mind when purchasing.
Firstly, as marked in my graph, I put a yellow line at the bottom.
This is where, I believe, is the support . For the past few days XLM has been falling back on this support line. I believe buying anything near this line would be a great start.
Therefore, I would buy in where I placed the blue rectangle . This range is between 0.00031008-0.00028623
Now of course before doing any major investments, we must make sure we have a stop-limit. I always believe that a stop limit should be around 5% give or take. Some people like to do stop orders around 7% so whatever you believe I think you should do.
The first milestone is the blue dotted line . (0.00032789) (Realistic)
This is where I will take my first cut out of XLM. It is important, as an investor, to be able to take some profit out to make the investment worth while. I like to only take around 10% of the total investment out at the first milestone.
The second milestone is marked at the green dotted line (0.00035174) (Realistic)
This is where I will take another 10% out, still keeping the majority of my shares but treating myself to some profits just in case it tanks.
The third milestone is marked at the orange dotted line (0.00036744) (Realistic)
Here is where I'll sell 40% of my shares, still leaving me with my other 40% for the last push.
The fourth milestone is marked with the red dotted line . (0.00039702) (Not as probable in a week)
This is the last and final push. I believe that when we hit the third milestone we will essentially be fluctuating around that until another final push. This milestone might take around 2-3 weeks.
Thank you for reading my post and I hope you enjoy. Make sure, once again, you do your own charting and research and let me know if you find anything that I missed. Happy trading!
-von braun

ZRXUSD Long, Uptrend, Potential Breakout SoonFA: The number of relayers operating on the 0x Protocol is growing, yet general awareness of 0x seems to be low. Decentralized exchanges are gaining popularity, and people will migrate towards them in the future, which is good for 0x. They have a reliable, active, and dedicated team. Any sort of big news could open the floodgate.
TA: The downtrend seems to be broken. After stagnating around the .185 to .21 levels for a few weeks ZRX seems to be bouncing off support and resistance as it finds new lows around 0.22 . If ZRX breaks the long term resistance at 0.245 we could see a larger breakout to around 0.28 levels. If it pushes past the lower support we may see another return to 0.18 range.
---------------------
This is my first idea on Tradingview; I am not a professional; I am practicing TA on cryptocurrencies. Do your own research. Happy Trading!
I hold ZRX and, I am bullish on a midterm scale, primarily because of the FA above.

Iconic Brands + Christie Brinkley + huge alcohol market = winnerIconic Brands has seen a healthy past few months, holding in a fairly tight trading pattern after a very impressive move up from the $0.000x range. The 2016 annual financials have been posted and of particular interest is the section that discusses debt settlement and terms being worked out to a fixed conversion of shares and not the typical toxic death spiral.
www.iconicbrandsusa.com <- worth checking out. Expecting some major growth throughout 2017.

Tesla's 1:6 trade opportunityThis morning Tesla's r(0.988) linear regression just touched a new low at 260.1, there are two possible scenarios:
Red arrow: Tesla's uptrend is over and investors should probably SHORT targeting 248.00.
Green arrow: Tesla is currently undervalued and may bounce back to the near resistance level at 286.88 continuing the r(0.988) linear regression.
My pick this time is a 1:6 LONG trade expecting the price to go back to the regression channel.
---
"We go to school to learn to work hard for money. I write books and create products that teach people how to have money work hard for them. " - Robert Kiyosaki

TWTR - Quick bargin price + new trend potential"Bargin price", after failed news and into supply zone + oversold zone. evidence of buyers and increased volatility, could be a quick one.

ABTL: Potential weekly uptrend, heavily accumulated stockThis stock is an example of a great mid cap stock to own. Valuation is just right around here, and there's a chance to confirm a weekly 'Time at mode' uptrend signal, which would imply seeing upside to the 22 handle or so.
Technicals show a strong accumulation base, with the RgMov trend analysis indicator surging, showing hidden strength in the background.
Downside risk is only $1.46 from entry, if buying at market open next week, giving us a 3.29:1 trade, not too shabby.
Good luck,
Ivan Labrie.

AAPL projected price movement$AAPL is a undervalued stock that has been hated by wallstreet for quite some time. Hence its undervaluation. Based on Bulkowski the following price targets has been stated in the chart.Do plan your stops accordingly. Upside valuation may change due where the breakout is at point of writing.
Do wait for a good breakout to confirm. I am not initiating a position in $AAPL because I am in $DRAD. Personally I am bullish for this stock because
1)Undervalued
2) Above 200 SMA
3)A breakout is seen (unless it's a false break)
4) I love apple heh heh heh

Long on DRADAfter a recent acquisition, revenue jumped. Guidance for revenue and EBITDA is essentially twice of 2015 for 2016. Going long

DRADsymmetrical Triangle spotted. I made a DCF of this stock and got 12/share. Bulkowski's measure rule puts it at 7.22
I am bullish on this stock.


Virgin Airlines: Up or down?Virgin Airlines was a growth stock turned sour. Even with fuel hedging and increase in revenue the market still does not approve VA and hence cause it's decline since it's high at december.
Technical: Based on the chart, there are 2 anomalies that one should take note when trading this.
1) Between $30(green line) and $26.42 (blue horizontal line), the price has found support. This is a crucial zone and it is absolutely crucial that you do not enter the trade unless you are very very sure of the fundamentals else you will be catching a falling knife. This is known as the accumulation/distribution phase where thousands of shares are being exchanged with no prior direction. It is also where liquidity is highest and many "big boys" are either unloading or loading up stock. Do check insider transactions for more info
2) The descending triangle is marked by the same support level and a decreasing resistance. Based on bulkowski's formula that sets price target based on probability. I have marked where the predicted price would go.
Fundamentals: Simplywall.st did DCF calculations and found it's fair value at around $14. This is close to Bulkowski's formula's prediction. VA is overvalued based on cash flow studies. However based on traditional ratio metrics VA is undervalued. P/E stands at 6.52. PEG stands at 0.26. P/S stands at 0.81 and EV/EBITDA stands at 4.67. They do have quite a bit of debt but their cash flow could easily pay it off.
Story: Investors believe oil and the Zika virus would affect sales of this stock heavily and hence they are bearish about it.
Would I go long? Yes! Once the price exited the $30 zone.
Would I go Short? Also yes!. Only of the price drops below $26.42!
Would I do anything now? No! I'm not catching a falling knife. Market is ??? about this stock. So trade after breakouts.

Contrarian investing vs catching a falling knifeI am not the author of the seekingalpha article even the though the title looks similar. I just find it cool and it rings.
For followers of Stan Weinstein chart analysis (do google this up, his technical analysis methods are really easy to use), you would have noticed that KORS has just exited stage 1 and is now at the possible start of stage 2. The high volume confirms this. Also, the crossover of the 30 SMA confirms this as well.
Fundamentally speaking, KORS has a low PS ratio of 2.05 (at time of writing) and based on Ken FIsher investment strategy, the PS ratio below 3 is fairly attractive. It also has low debts, which is a good thing as the Fed starts to increase interest rates.
DCF puts KORS at a valuation of $71. Interestingly this coincides with the 50% Fib retracement of this chart. I have bought 25 shares (I am a poor college student) at $50.06 and will prepare to sell at 50% Fib retracement.

VA short play on weeklyvolatility in oil and the recent sell off in oil is causing airlines stocks to be volatile as well.
VA is an undervalued stocks by many metrics, however technical analysis showed the lack of demand from this stock.
Combining the rising wedge, bearish divergence, and market volatility, I am expecting a decline over the next few weeks.
However, if it breaks it's a different story. Does anybody want me to calculate a price target?
