Natural Gas Preparing For A Major Move UpPlease review notes on chart. Don't sell yourself short by containing yourself in a linear format. Price action follows a curve.
UNG


Natty - One way down... Eventually.Not much to say here. It's been a very annoying "wait" for a short here but I "think" we got the beginning of a setup. Wait for a break of the lower trendline + flag. However, I think they might want to bring it up for one more push near the 50% retracement. GL

NATTY possible abcde correctionJust a quick observation here. This looks like a corrective structure. I'd LOVE to see the top part of trend line hit, BUT high volume was unable to break the "bigger tend line top" so maybe the fall starts now?
I still think "natty" has one more leg down before a major buy.


Natty - Don't fish.There is zero reason to bottom fish here yet. This is where patience on a long entry will save you a lot of headaches. There is still no clear divergence (RSI & MACD) indicating that this "could" be the bottom.
As you can see, the "rally" we had this morning is all gone, suggesting another leg lower. I've updated the natty chart with a clearer channel. I'm waiting on better signals for an entry.

Natural Gas. Looking it over. How it looks to me.Natural gas is such a great clean source of energy. A favorite for homes. Likely someday will power cars as well. Hard to believe longer term it will not become more expensive. But currently clearly in a shorter term downtrend (down about 5% today so far).
Looking at the daily chart it looks like we have already had a 5 wave up move and are now are in a abc correction. IFFFFFF correct when the correction is over I would expect at least one more 5 wave up. The colored target box seems is where I think the correction may well stop. Will be watching for positive candles or down trend line break.
Hope this will be helpful. Take care. Have a good week.

Natty Long Setup - Play of the year? It's time to pay attention to NATGAS this week. The next big move up is soon. First area of interest is the 2.95-ish area. GL

Nat Gas HVFWorth keeping an eye on the tightening range here.. A break has the respective HVF target in its direction. Targets line up surprisingly well with the extremes. I will be watching close to potentially start a position here in coming days.


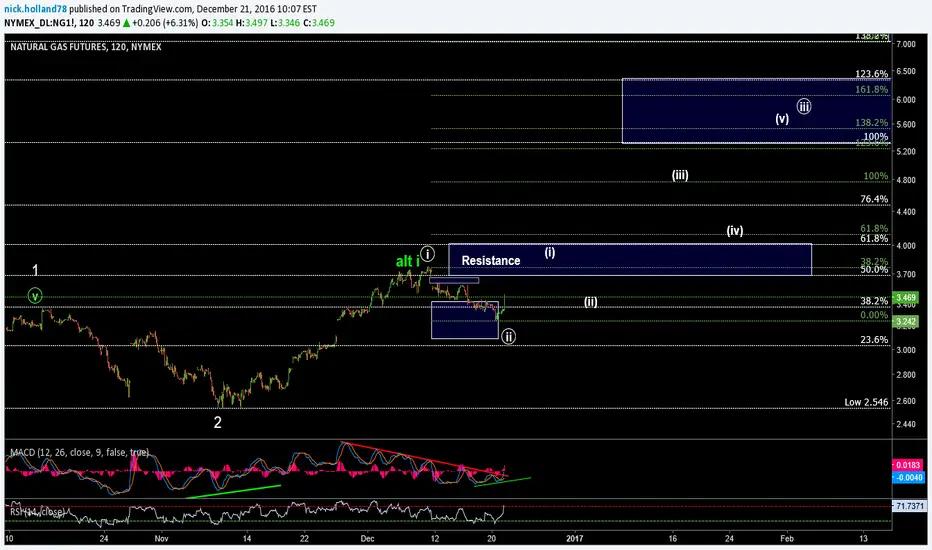
NG1! - 2hrStrong reaction out of the support box (see prior idea) may indicate wave cir-ii is complete. Stop at last low. Initial target is resistance in wave (i). Hold a corrective pull-back for (ii) and this could fly in wave (iii) of cir-iii of 3.
Green fibs are updated, matching the minute waves. White fibs are measured off of the presumed 1-2.

Cool weather will see gas retrace to pre-drop levelsSee a possible pull back to retest support then slow uptrend

I'm In! Nat Gas $UNG. See The Trade HereWhat an epic fall on natural gas lately. The commodity tracking ETF $UNG has collapsed from $9.65 to its current $7.00 in the last month. This is a whopping drop of 27%. I love collapses like this because it means there will be a big bounce. If an investor or trader can analyze the commodity chart correctly, there is huge money to be made. I did it. After analyzing the chart, natural gas is a buy here. I am in fact buying $UGAZ, a 3X Long Natural Gas ETF. This is riskier but gives you more payout on a hard bounce. Note the stock chart below to see the awesome support level being hit.
View my verified track record performance here: verifiedinvesting.com


NG1! - 1hMissed this rally. Saw the possibility but didn't like the probability.
Trade ideas: A corrective pullback in wave (ii) holding support would be an aggressive entry. An impulsive i-ii setup off the (ii) is safer ( better defined stop). Taking out the presumed coming wave (i) high is safest with stop below wave (ii).
NG1! - 2hrGreen count looks busted. Purple/pink count looks low probability. I'm on the sidelines waiting for a decent set-up to trade against. Either a bounce off the lower green 2 target or perhaps pink (ii) after 5-up for wave (i). Open to other ideas if you have them. Nasty corrective slop is what I see at the moment.

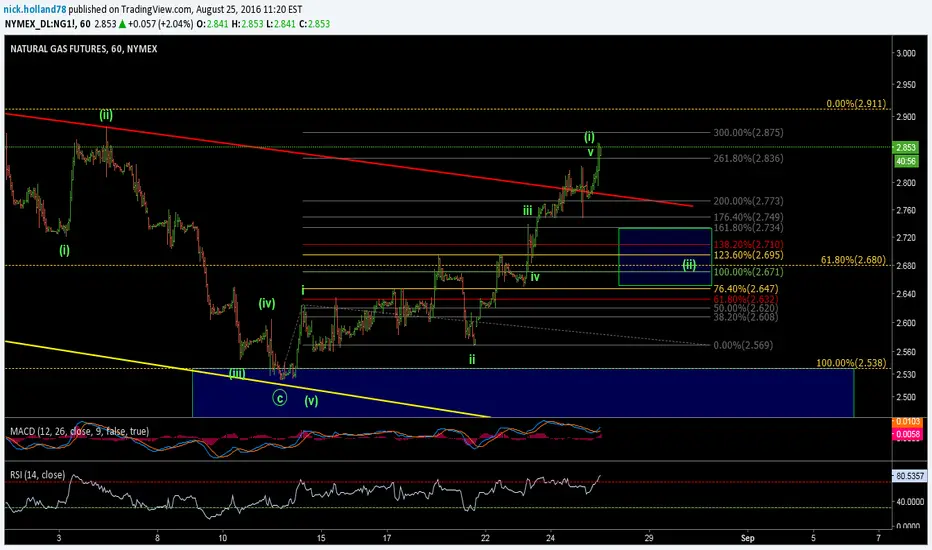
NG1! - 4hrRetrace hit c=100% a target and reacted overnight. Possible i-ii set-up formed during trading hours.
Earlier today I attempted a swing trade entry long UNG Sep 7.5 calls. The difference in my green and purple count is academic for this trade as I'll likely exit on wave (iii) of either purple 1 which might be wave iii of (i) in green 3 (not annotated).

FCG: Potential upside is hugeWe can take a long at market, or wait for 26.09 to get hit to jump in this trade. Stops should be below 23.55 to be safe. Target the 38 handle give or take. It's worth considering this setup, specially if NGAS resumes the uptrend.
Check out my updated track record here: pastebin.com
If interested in my real time whatsapp alerts and swing trading newsletter, or in personal tuition, contact me privately. I'm offering a considerable discount on a packaged course which includes access to my private trading signals list for a year.
Cheers!
Ivan Labrie
Link to Tim West's chatroom: www.tradingview.com
We discuss setups like this often there. Feel free to stop by and subscribe to his indicator pack. If you have any questions ask.
Risk disclaimer: My analysis is provided as general market commentary and does not constitute investment advice. I will not accept liability for any loss or damage including, without limitation, to any loss of profit which may arise directly or indirectly from use of or reliance0.25% on such information.


Natural Gas Pullback then LongAfter a mega run, Natural Gas needs to take a break and will be pulling back before beginning a new run upwards, likely toward the $6 range... it might not go that far, but it's going to have a lot of power behind it once it reverses. The daily time frame has broken the uptrend in COG and CMF, so the uptrend should end. I believe that Natural Gas will be one of the top performers in commodities over the next few years and I think that in a few weeks we will have an opportunity to get a great entry. Check out my last natural gas idea from two months ago. It was when I was first implementing my trading strategy and I really liked the Natural Gas chart, but it threw me a curve and I bailed... it has been frustrating to watch it go up like it has, but I've tried to learn from it.
