Natural Gas is wild!Natural Gas breakout or fakeout?
Our members banked by selling Ung yesterday near the highs.
We do think Nat Gas goes higher after more consolidation.
UNG

UNG Testing Complex Inverted H&S NecklineUnited States Natural Gas Fund(UNG) is testing the neckline of a complex inverted head and shoulders pattern with an open and close above the neckline on a gap up in price today.
Based on the orange line measurement taken from the lowest point of the head to the neckline we get $1.89 which can be applied to the opening price today above the neckline and gives an upper price target of $9.92 to watch for which is in the same area as the red horizonal resistance level stemming from the early march spike up to and rejection from $10.
Inverted complex H&S patterns have a 71% success rate which means we multiply $1.89 by .71 to give us an initial upper price target of $9.33. Assuming that we have a successful breakout of the neckline to confirm the inverted H&S pattern profit-taking should be begin at the $9.33 level and peak in the $9.92-$10 range for short-term traders. Personally, I tend to just raise my stop-loss level as price moves higher rather than selling at the upper targets in case price continues to move above the projected targets. This gives me wiggle room for price to fluctuate at resistance/target levels while also ensuring that the trade is profitable should price reverse and I get stopped out.
The lower PPO indicator shows the green line rising after crossing back above the purple signal line which indicates short-term bullish momentum. Both lines trending above the 0 level indicates intermediate to long-term bullish momentum.
The lower TDI indicator shows the green RSI line rising above the 60 level which indicates short-term bullish price trend. The green RSI line is also trending outside of the upper white Bollinger Band which indicates extreme bullish price trend; generally you want to remain long when the RSI is trading outside of the upper BBand. Price tends to correct to the downside when the RSI line falls back below the upper Band so keep an eye on that when it happens if you are are short-term trader. Overall, when the RSI is trending between the 40-80 levels as it has been sine mid-June the the intermediate to long-term price trend is considered bullish.
Overall, UNG is looking strong with bullish trend and momentum indicators as the price of Natural Gas moves higher along with crude oil.
My buy price was $6.93 putting me up about +15% on the trade so far. Stop-loss is still sitting at $6.54 which is where I set it the day I bought, likely will move it somewhere around $7.50 tomorrow to keep me in profit should price reject at the neckline. Should price continue seeing strength this week the stop-loss will be moved closer to $8, just below the neckline.
Info on complex head and shoulders bottom patterns: www.thepatternsite.com

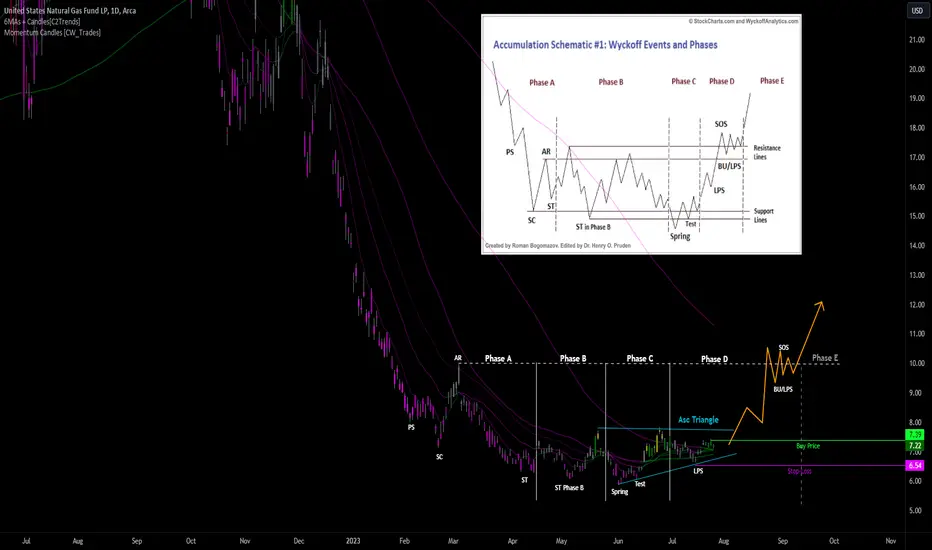
UNG Wyckoff Accumulation PatternUnited States Natural Gas Fund appears to be in the process of heading into the Back Up(BU) phase of a Wyckoff Accumulation pattern after levelling off in the $7 area after seeing a ~75% decline from the August '22 high near $35. There is also an ascending triangle pattern forming in phases C and D which tend to result in higher prices as UNG puts in a series of higher lows. What we want to see as a sign of strength going forward is for price to move above the upper blue line of the triangle pattern and follow the trajectory of the orange arrow which represents the anticipated path for price.
I've been in UNG since 7/20 with a buy price of $7.36. Current stop-loss order is at $6.61. No upper price target for now, just watching and waiting to see if price can break above the short-term resistance level at the upper triangle line near $7.85.
part 2 of 7 natural gas & mega cap tech and QQQ SPYnatural gas weekly uptrend still intact key battle zone now

BOIL ( 3x Nat Gas ETF) Reverses to UpsideOn shown on the 15 minute chart with a VWAP band/line setup anchored to the July 1st
pivot high. BOIL is in a VWAP breakout since bottoming mid-day July 17th. Confirming
the reversal are the Price Volume Trend Oscillator printing a green histogram and an
upgoing signal line as well as the zero-lag MACD with upgoing parallel lines crossing
the zero-horizontal line. Price has crossed over the mean VWAP. On the dual time frame
RSI indicator both the lower and higher RS lines ( blue and black) are above the 50 level
and the lower time frame is higher highlighting bullish momentum.
I will take a long trade targeting based on the VWAP lines first $65 and then $68. I will open
equal amounts of call options striking the targets with expirations on July 28th. I seek a
100% ROI in the next 6-8 trading days. On an intraday basis, I may enter a low DTE call option
at the low of day ( typically mid-morning) and exit at the high of day the same or next day.

Natural Gas Forecast | Trend Analysisfalling wedge pattern bull breakWeekly uptrend still intact Next level for is to break above $2.80 range

Natural Gas: Amazing Breakout!UNG & BOIL are looking poised to mive higher.
Energy trade is looking very optimistic from a technical standpoint.
This Bull flag target takes you to $3.25

Falling Wedge NatGas Gold Silver AnalysisGold and silver broke above falling wedge bullish
Natgas still chopping within it.

Natural Gas HELD SUPPORT What's NEXT? | Price Level Trend Analys- Natural Gas Stock Weekly uptrend still intact
- Natural Gas Natgas bear break lacking follow through
- Structure of the chart is ok as long as bulls hold above $2.53

Natural Gas - The Girl Who Hopes You Remember HerSince the end of February, and more accurately mid-March, the volatility on Natural Gas has all but disappeared.
This is a good thing if you're bullish, because it's both consolidation and indicates accumulation.
It's also a good thing from a sentiment/narrative perspective because everyone has all but forgotten trying to gamble on BOIL.
Moreover, it's strange for Natural Gas to trade so cheaply in light of the situation with the conflict between NATO and Vladimir Putin and how it impacts both China and Xi Jinping and Europe.
I've said in many of my previous natural gas calls that $10 wasn't the top. And if that supposition is true, the fact that we're trading at such an enormous discount for so long is really notable.
Just look how big the discount is on the monthly:
One of the core tenants of 2023's thus far price action being a likely bottom is that Natty has swept out the $2 mark twice, the last time in April.
Since, it's then made a series of higher lows and now looks certain to make higher highs.
Moreover, on the weekly we see any red bars are continually traded through to the upside by the MM.
All of this comes while the algorithm has been playing around the December of 2020 monthly pivot.
The fact that $2 has been protected so strictly and that the high of the year was set at only $3, which it touched for only a day, a Friday, to start March tells us that the target is more likely to be up than it is to be down.
It is very hard for me to tell you if Natty is going to do $3.2, $3.5, $4, or $4.5. It may just double top at $3 and then go back to $1.8.
What I can say is that getting over $4 ought to have a high degree of resistance. However, if the algs push it through, it's going to take off and take off in a hurry.
One thing that is true is that you really should not be bearish on energy.
I also believe that the Nasdaq in specific is about to correct so violently that it's going to set a new low.
We may be in a scenario right now where we see something like:
Equities correct
USD up
Energy up
Metals up
10Y yield up
VIX up
Instead of the usual everything down and everything up all at once shenanigans.
The world is running out of energy. Oil is not a bear market.
Worldwide and US production peaked in 2018 and hasn't come back.
A lot of the "oil" that is included in daily production numbers isn't actually crude oil but is "natural gas liquids" and other lesser substances.
In a climate where mankind is using more and more electricity and temperatures are getting hotter and hotter, there is no reason to believe that natural gas should stay this cheap.
How hot will July, August, and September be in North America?
Natural gas _is_ electricity. It's also plastics. It's also what the places that get winter use to fuel their furnaces to stay alive.
Are you really expecting $1.50?

Natural Gas Forecast | Price Trend GuideWeekly bounce off 50% fib retracement good sign for the bulls
weekly uptrend still intact, now we have a big enough bounce for bulls to try for the daily uptrend change

Using volatility for income trades - UNG 59% ivNatural Gas and other commodities offer alternatives to main show which is the stock market indices. The spx sp500 is currently offering very low volatility premiums because its been trending higher in smooth way, and put sellers have crushed premium there.
UNG etf offers an alternative potential opportunity for me since premium is high enough and its already had a nasty sell off for months since fall of 2022. With headlines of hot summers and potential higher energy use, Im comfortable nibbling at premium trades in UNG.

Natural Gas & oil UpdateOil looking strong and testing a bearish range breakout.
Natural Gas back testing a key support zone.

Natural Gas Stock Forecast | Detail Price Level Trend Guide |- Natural Gas Stock Weekly uptrend confirmed still intact
- daily trend change to downtrend
- Structure of the chart is still ok for the bulls if they hold 2.53

BOIL- Go Long SetupBOIL has had a busy month with the resurgence of natural gas prices and the reverse
split six trading days ago. I analyze it as having further upside. On the 30-minute chart
I have added two anchored VWAPs to the left on separate pivot points. This serves
to make out dynamic support and resistance. Price has crossed over the mean VWAP zone
which is between the heavy black lines. In confluence with that, it has crossed over the
POC line of the volume profile represents the price point with the highest total trading volume
over the visible time interval. Above price are the two targets being one and two standard
deviations above the mean aVWAP. The volume indicator shows increasing relative volume
overall as a sign of accumulation which generally results in price appreciation from
the demand trend. I will set the stop loss at $.10 below the POC line and take a long
position. One third of the position will come off upon each target advancing the stop loss to
above the entry and making the trade risk-free. Another third with TP2 and finally the
The remaining third will run on a trailing stop so I do not spend time micromanaging a smaller
position. I believe that my overall bullish bias will be rewarded yet again over the near term.

Natural Gas Forecast | Gold & Silver Analysis- natural gas bulls holding above 2.66
- Natgas resistance at 2.8 & 2.86 zone
- natural gas stock currently in a daily and weekly uptrend.

Natural Gas Stock Forecast | Gold Silver | Price Level Trend- Natural gas stock negated that hourly downtrend and bulls played defense
- natural gas natgas stock bounced off of strong support and now we have just have to break prior 2.8 high to continue the daily uptrend towards 3
- Gold & Silver Stock Falling Wedge Guide.

Natural Gas Due for a move to upsideI believe natural gas is respecting the support trendline quite strongly and as long as this trendline is held I am long on gas.
One thing is for sue, we are much closer to the bottom than ever before... it is amazing that NATGAS is now worthless! too much production and storage has contributed to this freefall (not to mention that I believe it is highly manipulated).
At some point the producers will cut production to balance their costs...

NatGas Gold Silver Forecast | QQQ Market Analysis- Natural Gas stock slight red flag today
- Natural Gas NatGas bull break above resistance today with no bull follow through and came below the resistance.
- Gold & Silver Stock Falling Wedge Guide.
- Silver is outperforming Gold and if silver weakens more Gold would likely break bearish through the falling wedge.
- QQQ needs to confirm a hourly downtrend before we can have more confidence that the daily lower high is set. So far bulls played defense and we are still in a hourly uptrend.

BOIL Day Trade Recap and ReviewBOIL the 3x Leveraged ETF of natural gas futures has been highly volatile. Volatility yields high
profits if there are good entries and trade management. This past Friday BOIL was doing a
reverse split ( 20 shares become one) which I considered to be an opportunity for high profit
because a higher number of traders would have eyes on the chart.
The 15-minute chart is shown here with an anchored VWAP from 2 days earlier. At market open
price reversed a downtrend after the reverse split in the premarket. It got support from the line
one standard deviation below the mean VWAP. My first considered entry was the second green
HA candle in the reversal with a stop loss at the pivot low of the red candles. However
I passed on this entry and instead entered upon price crossing the mean VWAP. The entry
was supported by the indicators showing Z score and volatility. The entry was made more
precise by analysis on the 5-minute chart. The stop loss was set at the value of the close of the
last candle to close below VWAP. After that, trade management was routine. Every time
price went up 1% I raised the stop loss by the same amount until getting up 6% Once at that
level, I changed to a trailing stop loss of 2% so I could pay attention to other trading chores.
At the same time, I set an alert for when the price crossed to above two standard deviations
above the mean anchored VWAP. I did this because this is the overvalued overbought area
where institutional traders will set sell orders either short selling or closing profitable
trades. The resultant reversal would diminish my unrealized profits. In this case, I got
the alert and closed the position without the trailing loss. The trade resulted in a profit
of 12% without use of leverage or margin other than the leverage imbedded in BOIL inself.

Natural Gas Price Level Trend Support & Resistance Guide- Natural Gas Weekly uptrend confirmed for the very first time since Aug 2022
- also confirmed a daily uptrend
- Structure of the chart is looking better for the bulls compare to the last couple months.

BOIL a scalp trade LONGBOIL had trended down from a high about May 19 until June 2nd when it reversed and gained
for one week before resuming its trend down. This can be seen on the half hour chart. The
The attached RS indicator shows the decreasing strength trending down from 65 to 40 over the
past few trading days. Upon drawing trendline support and resistance. I note that a descending
or falling wedge pattern is evident. This is a bullish chart pattern predictive of a price action
reversal. A volume profile is added to the chart showing the highest volume of trading at
the POC line corresponding to a price of $2.58.
I will trade a long trade on BOIL by way of a buy stop at $ 2.59 with a stop loss at $2.57.
The target will be the top of the high volume area of the volume profile @ $2.74.
This trade will risk $0.02 compared with a potential profit of $ 0.15 yielding a reward to
risk of 7.5. As it turns out, I did this exact same trade this past Wednesday June 7rh.
Besides 100 shares I will buy one call option striking $2.50 with an expiration of 6/30
to leverage the trade.

UNG continues to rise UNG the ETF that tracks natural gas futures has continued on a significant uptrend since June
1st The 2H chart suggests to be that the trend will continue this upcoming week. UNG is now
above the POC line of the long multi-session volume profile. UNG has had support from the
VWAP line representing two standard deviations below the mean. In recent days, price has
crossed that mean VWAP in a sign of bullish momentum. The volatility oscillator indicator
is showing bullish volatility while the RSI is high above 80 and staying there without any fade
to suggest bearish divergence. Overall, I will continue to run my position without any partial
take profit. My target is the VWAP line that is two standard deviations above the mean
anchored VWAP and so presently about 7.85. Any new trade would have the same target
while setting the stop loss just below the POC line.
