UNITED HEALTH On the 1D MA50 but only buy under this condition.United Health is having an incredible price jump today with the price hitting the 1D MA50 for the first time in one month and the 1D timeframe attempting to get out of its neutrality (RSI = 52.965, MACD = -5.780, ADX = 33.018). This state shows that we don't have a confirmed buy signal yet, that will only come if the 1D candle closes over the 1D MA50. If not, a pull back to the bottom of the ten month Channel Down.
The 1D RSI is also inside a Channel Down, a breakout there would also be a buy signal. So if the candle closes above the 1D MA50 we will buy and aim at the top of the Channel Down (TP = 512.50) expecting the whole rally to complete a +15% rise. If rejected we will buy near the bottom of the Channel Down and target again its top near the 0.786 Fibonacci leve (TP = 508.00). That is where the previous LH was formed.
## If you like our free content follow our profile to get more daily ideas. ##
## Comments and likes are greatly appreciated. ##
UNH

UNH UnitedHealth Group Incorporated Double TopA double top is one of the most bearish technical reversal patterns.
A Double Top Bearish Chart Pattern forms after an asset reaches a high price two consecutive times.
After applying the Elliot Waves Pattern on UNH UnitedHealth Group, we have 2 price targets: $459 and $396.
Looking forward to read your opinion about it.

LLY resistanceXLV health care has had a tremendous rally as money has moved into these defensive business models.
LLY looks primed for a decent pullback .

Perfect candlestick patternPerfect candlestick pattern on weekly chart, as a swing trader i would enter this trade but for me share is undervalued and maybe i would wait for a decline to look for long position entry for long term investment.It's not advice for trading just idea .

UNH UnitedHealth Group Incorporated Options Ahead Of EarningsIf you haven`t sold the Double Top:
Then looking at the UNH UnitedHealth Group Incorporated options chain ahead of earnings , i would buy the HKEX:520 strike price Calls with
2023-4-21 expiration date for about
$6.20 premium.
If the options turn out to be profitable Before the earnings release, i would sell at least 50%.
Looking forward to read your opinion about it.

United Health Earnings BeatOn Friday 14th April 2023 UnitedHealth Group reported full year and fourth quarter 2022 results reflecting broad-based growth at Optum and UnitedHealthcare.
Revenues of $324.2 Billion Grew 13% Year-Over-Year, with Double-Digit Growth at both Optum and UnitedHealthcare
Cash Flows from Operations were $26.2 Billion or 1.3x Net Income
Full Year and Fourth Quarter Net Earnings were $21.18 and $5.03 Per Share
Full Year and Fourth Quarter Adjusted Net Earnings were $22.19 and $5.34 Per Share
UnitedHealth Group affirmed the 2023 growth and performance objectives established at its November 29th Investor Conference, including revenues of HKEX:357 billion to HKEX:360 billion, net earnings of $23.15 to $23.65 per share, adjusted net earnings of $24.40 to $24.90 per share and cash flows from operations of HKEX:27 billion to HKEX:28 billion.

4/5 Watchlist + NotesInitial Notes - Personally did not trade today, Analysis was on point, rest of week should be exciting
SPY - So it looks like scenario 3 that I mentioned on my list last night played out today. We saw both targets to the upside and downside get hit. Premarket we were about 15 cents off of the upside target before opening and pushing higher than yesterdays high. We then saw a sell off during the day to hit our downside target and also create a bearish engulfing, which was scenario 3 mentioned yesterday. I did not get to trade today due to being extremely busy with my personal life, but I was still very happy to see that my analysis was on point, making us 2/2 on the week for predictions. (FOR TOMORROW) Tomorrow I am looking for downside, plain and simple. With the bearish engulfing now created, overextension/exhaustion starting to kick in, and potential for us to create a failed 2U on the weekly chart all tells me that we have some decently bearish catalysts for tomorrow's session. I do not have a specific target for tomorrow to the downside, but if you look at the chart attached to this watchlist, you can see that we formed a broadening expansion on the daily. I am hoping to get close to, test, or surpass the bottom trend line. We must keep in mind that although these engulfing setups typically play out well (The last 7 on SPY's daily have resulted in correct movement in the engulfing candles direction or inside days following), it does not guarantee that we follow suit and see downside. We are still not confirmed reversing yet on longer time frames, but today could very well be the beginning, or sign that we are close to reversing. OVERALL: I want to see us head further down. My rough estimate/target to the downside is 406.43. IF we are lucky then we could see as low as 404.
Watchlist + Bias
MRK 2-1 Daily: Neutral
CRM 2-1 Daily: Bearish
MRNA 2-1 Daily: Neutral
UNH 2-1 Daily: Slightly Bearish
DOCU - 1-3 Daily and 2-1-1 Weekly: BEARISH
SQ - 3-1 Weekly: Neutral
Previous and Tomorrows Main Watch: DOCU + SHOP
SHOP - Neutral on this one. It played out the way we wanted too, but did not hit the target we expected, and was choppy all day. Overall I count this as a win because it followed our criteria and played out as expected, but was hard to catch an entry on if anyone did/tried to, and did not move as much as I had hoped for.
DOCU - We STILL have not broken out of the weekly inside setup. Today ended the same as SPY. Bearish Engulfing, with SPY looking like it could reverse any day now, I have to be bearish on DOCU as well. As far as winner/loser status goes for today, I respectfully think this one was an L. It opened under long entry and pushed up slightly above that entry during the first 10 mins of market open before being shot down along with SPY. I personally did not take this trade, but I can see why it may have been a losing trade. For tomorrow, I think a test of the weekly short entry is inevitable, and I will be watching closely to get in some 1-2 week out puts, as well as some close expiry contracts for a day trade. Weekly short trigger is at 56.01. Targets set at 55.24 and 54.86
Watchlist Stats:
2/2 SPY Predictions
2/3 Main Watch Plays
Top Winner: SQ 23%+
Personal Stats:
0/1 on the week
Overall Red
- Did not trade today so stats remain the same.
Lets make some money tomorrow! Good Luck all!

United Health: Healthy As A… Bear? 🐻… or what was that saying again? Anyway, after a short hiatus, the bears in our United Health-chart should regain their health and get back to work. They should soon push the share below the support at $456.73 and from there into the dark green zone between $427.67 and $391.43, where wave A in dark green should end. This low should then be followed by a considerable upwards movement above the resistance at $501.40. There is also a 37% chance that United Health could cold-shoulder the dark green zone and climb above $501.40 directly. In that case, we would consider wave alt.A in dark green to be already finished.

UNH SELLWelcome . Arrow . UNH . very negative. And there is more going down. After breaking the uptrend and 500 support

UNH Leaving WinterBears coming out of hibernation on UNH, doji candles meaning indecisive buyers/sellers followed by bearish engulfing candle resulting in a reversal of trend.

UNH at an inflection point. UNH is hitting critical support. If it closes below support a topping formation will be on watch. This stock is heavily weighted in the XLV.

SPX500 / ES / SPY - Enjoy the Party While It LastsThe period of market activity following the November CPI pump has been both a choppy grind and hard to get a handle on. I had personally believed that the market makers would run 3,700 long ago, but that we wouldn't set new lows.
Turns out, after much deliberation, they ran 4,150 instead and dumped it back to 3,800 but still haven't taken 3,700.
When trading, anyone who genuinely "knows" what is going to happen also isn't allowed to speak to the public. There are contracts binding their mouths with big penalties for violation.
Ergo, literally all of us who are trying to do this are making a best-basis effort to anticipate what's going on and what's going to happen with limited information available.
What this means is that to increase your accuracy and avoid blowing yourself up, you have to continually revaluate what you think is going to happen on the basis of what is actually happening in front of you. This is an important ability to build, but there's a lot of inner obstacles. You can only do it via determined and diligent mental and emotional self cultivation and improvement.
All on its own the last 45 days of price action tells us something. The December FOMC rendezvous with the September CPI dump formed a double top where big, big fund positions selling short will be carrying market buy orders to exit their positions as part of their risk model because "resistance was broken."
In terms of the market retracing and coming back to take out that level, this doesn't always work out, as seen on both Tesla at $315 and WTI Crude at $93.
But, when combined with this three week period of "bear flagging" (it's just consolidation) and, as we saw on Friday with an unwillingness to trade lower even on Non-Farm Payroll day, arguably the third most volatile news driver of the month behind CPI and FOMC, it tells us more.
Looking at daily candles,
The fact that the market makers appear to want to trade higher without trading just a little bit lower to take the giant fund sell stops at 3,700 indicates to me that the biggest cowboys are actually long and the intention is to keep selling.
Now, you're probably used to thinking, "Doesn't the price go down when big money is selling? Doesn't it go up when they're buying?" The answer to that is yes, but no.
Think about it: if the banks were to sell low and buy high and then buy high and sell low, like you do, wouldn't there be a 2008 financial crisis all the time? Wouldn't they also blow their accounts like you do?
Instead, although it takes a lot of money to buy and sell the orders planted along the way, the reality is that big funds and banks are selling on green and buying on red.
Selling on green and buying on red.
I've heard if you work at a trading desk and you buy on green and sell on red you'll quickly find yourself holding a filing box on the sidewalk waiting for the Uber to take you back to your apartment.
This is really worth thinking about.
Looking at monthly bars, last January was a 600 point nuclear month. The algorithms, although they do perform fractals on a consistent basis, generally, do not like to repeat themselves in such an obvious way.
Ergo, expecting January '23 to be a big nuclear month may be a bit of an error in judgment.
I think everyone now understands that the global economy is in big trouble, the living environment is in trouble, and on top of that the central banks aren't in the mood to run a bailout or a rate cut to save markets from crashing.
And yet, they don't crash.
That's because it's the same idea as the blade of a guillotine. Before you drop the hammer and decapitate your victim, you first slowly pull the rope so the knife is hanging high over head.
"The bigger they are, the harder they fall."
I believe that what we're about to see happen is SPX 4,230. There's a gap conveniently placed right above the double top from before September CPI. Both this and the late December pivot @ 3,79x are both very obvious on weekly candles.
Once we get there and everyone has turned bullish again and forgotten where they are in the diagram, then it's time to start looking seriously at getting risk off and buying puts.
Once the calamity really starts to unfold, you aren't going to see consolidation like this and we're not likely to get big bounces along the way. The kind of 200 points down one day 200 points up the next saw during COVID hysteria also isn't likely to unfold.
It's just a question of what the catalyst will be.
And that catalyst may very well come in the form of "China."
I say "China" because although it may unfold in the nation of China, the issue is the Chinese Communist Party. You really have to separate that rogue regime from "the Chinese people" and "the Chinese nation."
China is being absolutely sacked by Wuhan Pneumonia. The pandemic situation there is not like the COVID pseudo-pandemic we saw in North America. And this situation has been true for the better part of 3 years.
Although the CCP covers it up and hides the data, just like they did during 2003 SARS, nobody seems to have learned their lesson that the regime is a chronic liar. Or at least, when it comes to the topic they exercise "Three Monkeys."
One day that isn't all that far away, Xi Jinping and the Party will really be unable to contain reality any longer. In the same way that a forest fire that's absolutely out of control and absolutely raging will eventually roll towards the city (See 2016 Fort McMurray wildfire) and start smashing up industry, people, lives, and the regime for real.
The warnings signs of this will be kept quiet by western media until it can't be hidden any longer. So you likely won't get much notice besides that prices stay high while volume drops and the USD and VIX start going on a "weird" moon mission.
When it starts, you'll be greeted by unprecedented Monday morning breakaway gap downs that never recover.
Ultimately, what I want to say to everyone who reads this is that the tribulation won't be limited to China's borders and will quickly become international. It will be the kind of thing that global governments cannot keep a handle on, either, and the problem will concern more than your stock portfolio.
To evade and escape the disaster, it's absolutely critical that you do your part to oppose, reject, and stop supporting the Chinese Communist Party and all the Marxist-Leninist, socialist things it has spread around the world during the last 23 years via the United Front Work Department.
It's a choice you both have to make, and one you'll be forced to honour by history.

UNITED HEALTH Buy Opportunity for this quarterThe UnitedHealth Group (UNH) hit the Resistance Zone following our last (November 18) signal but as it failed to break through its top, it got rejected:
By doing so, the price even broke below the Higher Lows trend-line and the Bullish Megaphone pattern, that were in effect since February 2021. This potentially signals a deceleration on its enormous and sustainable rise but not necessarily that it turns bearish. In order to do so, it needs a closing below the 1W MA100 (red trend-line).
Right now with the price on the 0.382 Fibonacci level and the 1D RSI oversold at 30.000, it is on the very same spot it was on the June 17 2022 Low. See between the two fractals, the successive hits on the 1D MA200 (orange trend-line) and 1D MA50 (blue trend-line).
As a result, we consider this a buy opportunity back to the bottom (551.00) of the Resistance Zone.
-------------------------------------------------------------------------------
** Please LIKE 👍, FOLLOW ✅, SHARE 🙌 and COMMENT ✍ if you enjoy this idea! Also share your ideas and charts in the comments section below! This is best way to keep it relevant, support me, keep the content here free and allow the idea to reach as many people as possible. **
-------------------------------------------------------------------------------
You may also TELL ME 🙋♀️🙋♂️ in the comments section which symbol you want me to analyze next and on which time-frame. The one with the most posts will be published tomorrow! 👏🎁
-------------------------------------------------------------------------------
💸💸💸💸💸💸
👇 👇 👇 👇 👇 👇

UNH - Bearish Bias idea applying the STRAT My Bearish bias is a result of an attempt to again reach highs but a failure and 2-2 continuation to the downside to unfold. Entry in white and possible targets in green.

UnitedHealthGroup Analysis 19.11.2022Welcome to the BasicTrading channel.
My name is Philip and in todays analysis I quickly go over the situation which we currently have on UnitedHealth Group.
I will analyse the asset both from a weekly and daily timeframe to show you the best possible trading opportunities.
If you enjoyed this analysis, let me know in the comment section which asset I should analyse tomorrow.
I will personally reply to every single comment.
Dont forget to smash that rocket and I will see you tomorrow with a new analysis.


UNITED HEALTH Stronger than ever one last Resistance to go!The UnitedHealth Group (UNH) has been on a strong 3 day rise since the November 15 Low which was a Higher Low within a hyper long-term Bullish Megaphone pattern, with the trend-line holding since February 22 2021. On top of that it rebounded within the 1W MA50 (red trend-line) - 1D MA200 (orange trend-line) zone, which has more or less priced all prior major Higher Lows.
The next barrier standing is the 553.00 - 559.00 Resistance Zone that is holding since the April 14 2022 High and has had another two rejections, forming an Ascending Triangle. Needless to say, a break above it would be a major bullish break-out signal. As to the target? That would be initially the 1.382 Fibonacci extension, around $590.00, which is the symmetrical of the Fibonacci retracement levels that have formed the last two Higher Lows. As seen on the chart, the November 15 2022 Low was made on the 0.5 Fib while the October 13 2022 on the 0.382 Fib. We can argue that if there is one more rejection on the Resistance Zone, then the 0.618 Fib is a candidate for the next Higher Low.
-------------------------------------------------------------------------------
** Please LIKE 👍, SUBSCRIBE ✅, SHARE 🙌 and COMMENT ✍ if you enjoy this idea! Also share your ideas and charts in the comments section below! This is best way to keep it relevant, support me, keep the content here free and allow the idea to reach as many people as possible. **
-------------------------------------------------------------------------------
You may also TELL ME 🙋♀️🙋♂️ in the comments section which symbol you want me to analyze next and on which time-frame. The one with the most posts will be published tomorrow! 👏🎁
-------------------------------------------------------------------------------
👇 👇 👇 👇 👇 👇
💸💸💸💸💸💸
👇 👇 👇 👇 👇 👇


UnitedHealth Group UNH - Double Top? Short IdeaDespite this year's bloodbath of stock prices, UnitedHealth Group (UNH) has shown considerable strength and has continued to the upside. I did want to take a macro look using the monthly chart and noticed a double-top forming. The company does have strong fundamentals with earnings goals being reached every quarter. However, the stock price is showing strain to the upside with this double-top and appears to me that buyers may be losing the battle short-term. Furthermore, we can see the MACD is coming to an end as well and may enter bearish territory in the very near future. It very well could be a chance to short this stock which is showing some upside stress signals in the near future.
Curious to hear others' thoughts?
Thanks for stopping by!
KC

Another Short on UNH. UNHI have lost count of the number of successful shorts I've had on this say over the last six months.
Momentum flipped, PSAR close to. Elliott is always the main drive to all of our decision making, however.
We are not in the business of getting every prediction right, no one ever does and that is not the aim of the game. The Fibonacci targets are highlighted in purple with invalidation in red. Confirmation level, where relevant, is a pink dotted, finite line. Fibonacci goals, it is prudent to suggest, are nothing more than mere fractally evident and therefore statistically likely levels that the market will go to. Having said that, the market will always do what it wants and always has a mind of its own. Therefore, none of this is financial advice, so do your own research and rely only on your own analysis. Trading is a true one man sport. Good luck out there and stay safe.

$UNH Bearish Quarterly Inside Shooter$UNH is showing a potential 2-1-2 bearish reversal with an inside shooter candle.

UNH $UNH Initial ShortUNH $UNH Initial Short. TP and SL on chart. Move SL on TP. After TP2, trail with 0.5ATR step and 1.5ATR offset.
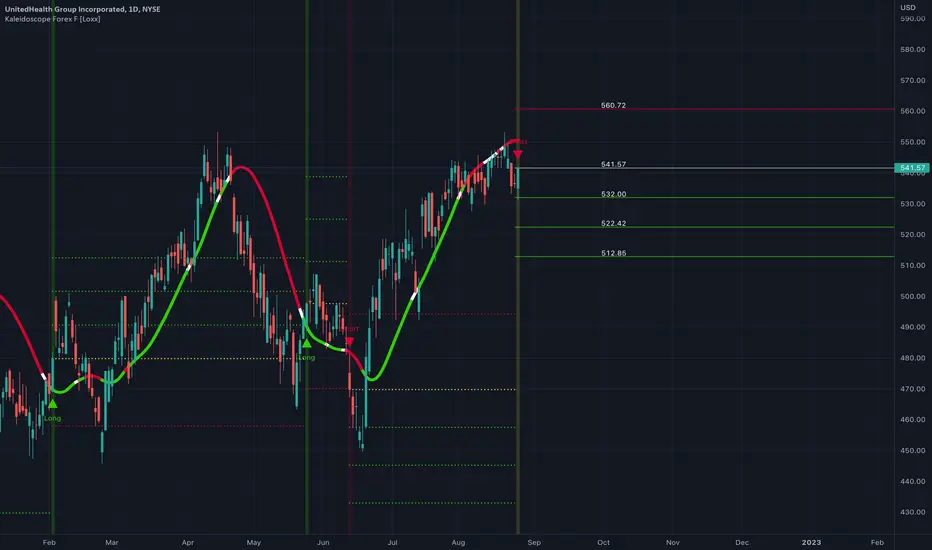
$UNH HERE WE GO 🚀🔸️Ticker Symbol: $UNH 🔸️Timeframe: 4H 🔸️4X Bull Pattern 🔸️Investment Strategy: Long
TECHNICAL ANALYSIS: $UNH is currently breaking a strong resistance level in the market at $548.58. I do believe if we can continue in this 4X bull pattern we could potentially see $560 next week on $UNH. Let me know what your investment strategy is.
4X 🟢 Bull Pattern Confirmation Requirements
✅️ Linear Regression Indicator Increasing
✅️ Money Momentum Shifting Higher
✅️ Green Dot: Key EMA Crossover to Upside
✅️ Green Middle Band: Bull Market Momentum
4X 🔴 Bear Pattern Confirmation Requirements
🔻 Linear Regression Indicator Declining
🔻 Money Momentum Shifting Lower
🔻 Red Dot: Key EMA Crossover To Downside
🔻 Red Middle Band: Bear Market Momentum
🔔 Follow for daily stock, crypto and forex technical analysis.
⚠️ Trading is risky, and I understand nothing is guaranteed. Proper risk management should be in place at all times to minimize losses. Please consult a financial advisor before trading. Trendsi Trades LLC is not a financial advisor and may not be held liable for any losses which may occur.
