UNI up 13% – is $10 the next stop?Hello✌
let’s dive into a full analysis of the upcoming price potential for Uniswap 📈.
BINANCE:UNIUSDT has maintained solid bullish structure within a well-formed ascending channel and is now approaching a key daily support zone. Recent volume spikes and a 13% price increase indicate growing buying interest. A breakout above the channel resistance could open the way toward the psychological target at $10, a level watched by many traders. Monitoring price action and volume confirmation here is essential for potential trend continuation. 📈🧠
✨ Need a little love!
We pour love into every post your support keeps us inspired! 💛 Don’t be shy, we’d love to hear from you on comments. Big thanks , Mad Whale 🐋
UNI

Uniswap Exits Opportunity Buy Zone · $73 & $118 2025 ATH TargetUniswap is finally out of its long-term opportunity buy zone, a trading range that was activated first in 2022 and remained valid for a long time.
After October 2023, UNIUSDT produced two bullish moves but each time fell back into this zone. Orange/brown on the chart. Notice how this zone matches price action happening below EMA89, EMA55, MA200, EMA144 and EMA233. As Uniswap turned bullish and fully confirmed, it broke above all this major levels.
Last week, it managed to close above the really long EMA233 and this week the action is staying above. Currently $10.30.
Notice waves "1" and "2" these are relatively small waves. Something will happen with #3. The market evolves exponentially. Instead of another similar wave going a bit higher, it will be something like 2021. Not like 2021 in the sense that it will reach similar price levels, but in the sense that it will be completely out of proportion with what you saw in the last several years. Prices will go off-the chart.
We can think of resistance as a new all-time high being found around $73 and $118, but this time I only want to call your attention to this moment now. The fact that market conditions are changing and it is still early when we focus on the long-term.
I just realized that I might be seeing things differently and it is hard to visualize, for someone without the actual experience, what is about to happen. But despair not because that is the one reason why I am here and why you are reading this. I am here to alert you, remind you and prepare you for an event before it happens. In this way, you can profit and achieve your financial goals. I want to give you value in exchange for your trust. Will you trust? Uniswap is going up. Crypto is going up and it will be the best since 2021. Possibly the best bull market in the history of Crypto, the new regulatory framework and global adoption is saying so.
Thanks a lot for your continued support.
Namaste.

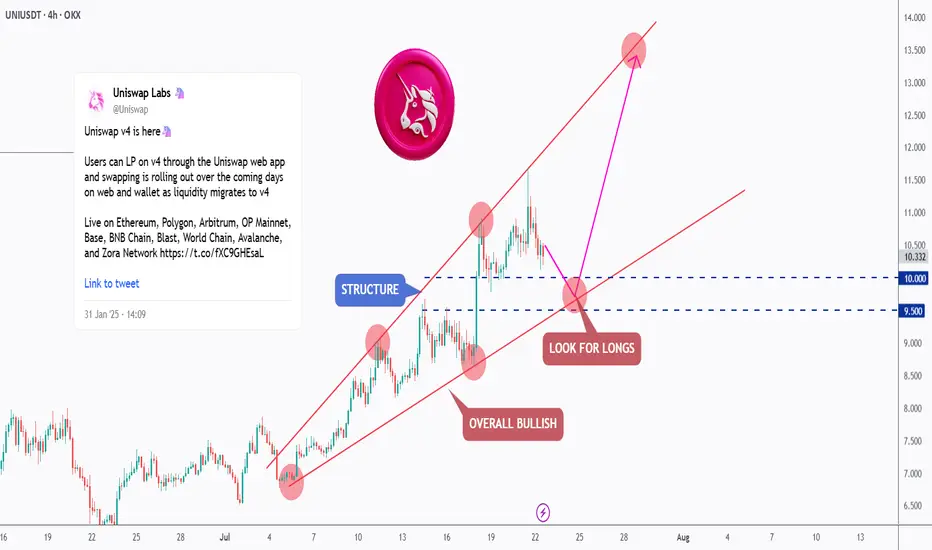
[Deep Dive] UNI – Edition 1: Retest. Reload. Rally?Uniswap (UNI) has been trading within a well-respected rising channel, showing consistent bullish structure across the 4H timeframe.
After a strong rally from the $7.50 region, price is now undergoing a healthy correction — retesting the lower boundary of the channel, which intersects with the $9.50–$10.00 demand zone.
📐 Technical Outlook
The market has printed a series of higher highs and higher lows, confirming the bullish momentum. The recent correction is testing a key support structure — previously a resistance zone — and this confluence aligns perfectly with the channel’s lower bound.
As long as this zone holds, UNI is well-positioned for a continuation toward the $13–$14 region, in line with the pink projected path.
🔥 Fundamental Boost
Uniswap has recently launched its V4 upgrade, introducing "hooks" — customizable smart contracts that allow developers to build more complex DeFi logic directly within liquidity pools. This upgrade not only enhances flexibility and capital efficiency, but also reduces gas costs — making Uniswap an even more dominant player in the DEX ecosystem.
Additionally, with Ethereum L2 adoption growing and Uniswap expanding across multiple chains (Arbitrum, Base, and Optimism), protocol usage and fees are on the rise again.
The UNI token may soon benefit from the proposed fee switch, which would redirect a portion of protocol fees to token holders — potentially adding new value accrual mechanics.
🟢 Conclusion
The technicals and fundamentals are aligning. UNI is in a bullish structure, trading at a key area of interest, and the latest upgrades may unlock new growth for the ecosystem.
Traders and investors alike should keep a close eye on this zone for long opportunities, as the next impulse could be just around the corner.
💬 What do you think — is UNI ready to break toward new highs, or will the demand zone fail? Let me know in the comments 👇
🔔 Disclaimer: This analysis is for educational and informational purposes only. It does not constitute financial advice or a recommendation to buy or sell any asset. Always do your own research and manage your risk accordingly.
📚 Always follow your trading plan => including entry, risk management, and trade execution.
Good luck!
All strategies are good, if managed properly.
~ Richard Nasr
UNI Market Cap Breakout Signals Major Repricing Ahead 🚀📈 UNI Market Cap Breakout Signals Major Repricing Ahead 💥💹
Forget the December highs. That spike? It came with a bloated market cap and little real growth. T oday, it’s different.
UNI has reclaimed the key $10 level, but more importantly, its market cap structure is breaking out after years of compression — and that’s where the real alpha lives.
🔍 Technical View (Market Cap-Driven)
🔹 UNI broke above the $10.94 price zone with strong momentum
🔹 Currently retesting the $9.73 breakout base — a critical zone for bullish continuation
🔹 Market cap structure targets:
– Next milestone: $14.72 (aligned with local resistance)
– Macro extension target: $17.70, corresponding to a market cap near $18.08B
This puts UNI at the doorstep of a major repricing phase.
🧠 Why This Time Is Different
✅ Market Cap Breakout – We’re not just looking at price anymore. The structure on the market cap chart shows accumulation and a clean breakout from multi-year compression.
✅ Whale Activity – Addresses holding 1M+ UNI are growing fast. Over $60M in UNI was moved off exchanges in July alone.
✅ Protocol Expansion
– Uniswap v4 is imminent, introducing Hooks, dynamic fees & native ETH support
– Unichain L2 has now hit 6.3M wallets and 147M txs, growing faster than expected
✅ DeFi Rotation – Capital is rotating back into blue-chip DeFi. Uniswap isn’t just riding that wave — it’s helping define it.
🏁 What We’re Watching
🟦 Support: $9.73 – this must hold for continuation
🟩 Target 1: $14.72
🟩 Target 2: $17.70 (aligned with $18.08B mcap)
🟨 Risk zone below: $9.03 – invalidation if daily closes below
This is not about retesting old prices. It’s about rewriting the valuation story.
The UNI bulls aren't just hunting a T-bone — they’re after a full 8-figure steak. 🥩🧠
One Love,
The FXPROFESSOR 💙
D isclosure: I am happy to be part of the Trade Nation's Influencer program and receive a monthly fee for using their TradingView charts in my analysis. Awesome broker, where the trader really comes first! 🌟🤝📈

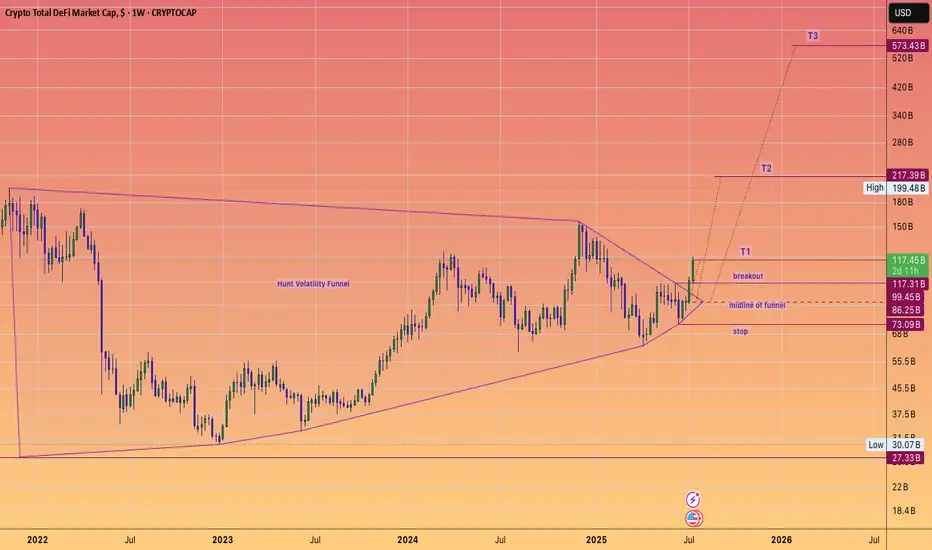
DeFi Moonshot! Moon mission to $573 Billion dollars!DEFI fuelled by Ethereum, built on proven protocols and stablecoin legislation is ready to keep cranking higher for the rest of the year. And instead of a Defi summer of emergence (2020), a multi season of adoption that takes it to half a trillion dollars, hitting these targets of a #HVF
@TheCryptoSniper
The components set to benefit are:
Uniswap #UNI ~ $12.3 Billion
Lido DAO #LDO ~ $9.1 Billion
Aave #AAVE ~ $7.5 Billion
MakerDAO #MKR ~ $4.6 Billion
GMX #GMX ~ $2.5 Billion
Curve #CRV ~ $1.9 Billion
Synthetix #SNX ~ $1.1 Billion
Pulsex #PLSX ~ $0.46 Billion
Key points:
The #TotalDefi index is currently at $117B aligning closely with the $123.6B of TVL
As we see hundreds of billions of dollars get digitized watch this index climb onwards and upwards... With $1 Trillion dollars and obvious milestone that is surely set to be met ... one day.
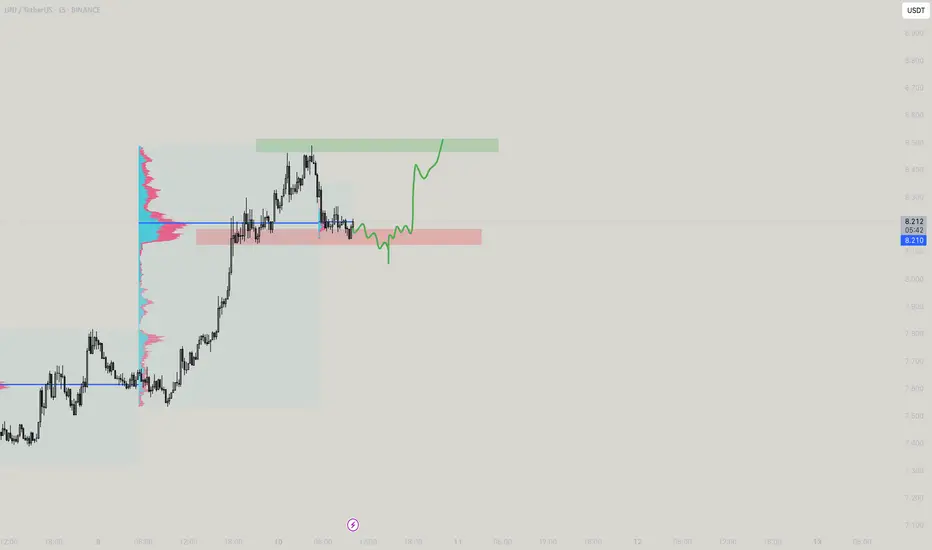
UNI Long Setup – Breakout Retest into High-Confluence SupportUniswap (UNI) has broken out of resistance and is now pulling back into a high-confluence zone, forming a strong bullish structure. The $7.13–$7.73 area presents a favorable entry on the retest.
📌 Trade Setup:
• Entry Zone Around: $7.13 – $7.73
• Take Profit Targets:
o 🥇 $10.50 – $12.85
• Stop Loss: Daily close below $6.50
UNI - One more Unified Trade!As seen here, looks to go up, little bit of liq dump is needed for further up
TradeCityPro | UNI Builds Pressure Below Key Resistance Zone👋 Welcome to TradeCity Pro!
In this analysis, I’ll be reviewing the UNI coin — one of the notable DeFi tokens, currently ranked 27th on CoinMarketCap with a market cap of $254 million.
⌛️ 4-Hour Timeframe
On the 4-hour chart, as you can see, UNI has formed a bottom around the 6.043 level, which is considered its key support zone. After reaching this level, the price began an upward move, though the trend appears very weak.
✔️ Currently, there’s a resistance zone just above the price that has previously caused multiple rejections. Once again, the price is moving toward this zone.
📊 The volume during this latest upward leg is very low, which is not a good sign for initiating a bullish trend. If the price reaches this resistance level with such low volume, there's a high likelihood of another rejection.
🔽 If that happens, we could consider opening a short position based on this rejection. However, my main trigger level for a short is the break below 6.896 — I personally would wait for this level to be breached before entering a short position.
✨ The next key support, in case 6.896 is broken, is the 6.043 zone. This is a major support level and could serve as the target for the short trade. If this level is broken as well, it could mark the beginning of a strong downward trend.
🔍 On the other hand, if volume starts to pick up and the resistance zone is broken, we could open a long position. The target for this could be around 8.678 — or even a setup in anticipation of a breakout above 8.678.
🔔 Which scenario you choose depends largely on your market perspective. If you're looking for a short-term trade, the first scenario is more appropriate. But if you're aiming for a long-term position with a wider stop loss, the second scenario would be the better choice.
💥 In either of the long scenarios, I strongly recommend confirming the move with volume. For further confirmation, you can also check if RSI enters the overbought zone.
📝 Final Thoughts
This analysis reflects our opinions and is not financial advice.
Share your thoughts in the comments, and don’t forget to share this analysis with your friends! ❤️

You are UNI! Not UNIC!I mean you are unique!! But this is more unique in its place and we see the moves to be more more more precendented!


Uniswap UNI price analysis🦄 Despite the weak crypto market, #UNI is holding up quite well at the moment, so you should take it "on a pencil".
At first, the “big money” are buying, and then the news will be rolled out.
🕯 The OKX:UNIUSDT chart shows increased trading volumes.
We wouldn't be surprised if in the coming days, when the market moves into a "range", the price of #UNI shoots up to $9.31 or even $11.21
💰 And globally - the price of $22 per #Uniswap token can still be considered a fairly modest forecast.
_____________________
Did you like our analysis? Leave a comment, like, and follow to get more

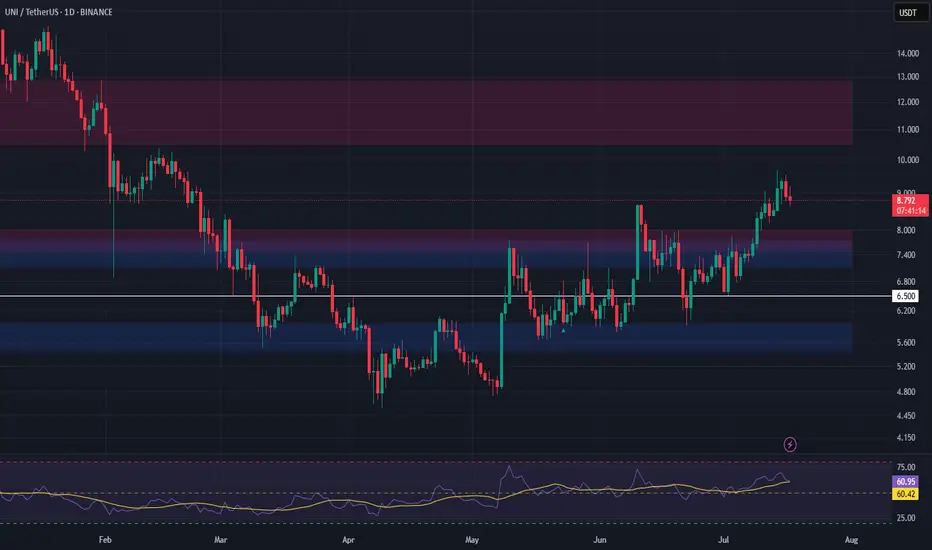
UNI 1D. Breakout Coming? Long-Term Setup Explained 06/11#UNI has been trading in a wide range between $4.072 – $18.634 for the past three years. This is known as an accumulation phase, where large players may be building positions ahead of the next major price move.
After a steep decline, the price bounced off the key support zone at $5.623 – $4.753. It then reclaimed and held above $6.325, a historically high-volume area — a bullish signal.
For short-term entries, I recommend waiting for confirmation above the 100-week moving average (MA100), which currently sits around $7.671. A break and close above that level would suggest a trend reversal.
🎯 Targets:
• $12.063
• $15.305
📥 Mid-term accumulation zone:
• $5.623 – $4.753
• If price drops to $4.072, it could be another solid buy opportunity.
DYOR.
UNISWAP - Long Term Buy Opportunity 🚨MartyBoots here , I have been trading for 17 years and sharing my thoughts on UNI here.🚨
UNI vs ETH | Why Uniswap Deserves a New All-Time High
In this video, we dive deep into the fundamentals of Uniswap (UNI) and explore its close relationship with Ethereum (ETH)—the blockchain it’s built on. While ETH has regained massive attention with its expanding ecosystem and institutional adoption, UNI is still massively undervalued in comparison, despite powering one of the largest DeFi protocols in the world.
⸻
Fundamentals Breakdown:
• Uniswap is the backbone of decentralized trading, facilitating billions in volume without intermediaries.
• Fee switch mechanics and upcoming v4 upgrades have the potential to drive real yield to UNI holders.
• Unlike ETH, which serves as a Layer 1 gas token, UNI represents governance and future revenue potential over a growing protocol.
⸻
Why UNI Has Upside:
• UNI still trades far below its all-time highs—even as Ethereum ecosystem activity rebounds.
• ETH has already made major recovery moves, but UNI hasn’t caught up yet—creating a bullish divergence.
• With the rise of on-chain liquidity, tokenized real-world assets, and institutional DeFi, Uniswap is positioned to be a key infrastructure layer.
⸻
My Thesis:
• ETH = Base Layer | UNI = DeFi Rail
• As ETH grows, Uniswap scales alongside it—capturing more swap volume, TVL, and governance power.
• If Uniswap activates protocol revenue, UNI transitions from a governance token to a yield-bearing asset, giving it real valuation metrics and long-term investor interest.
⸻
Watch to see my full breakdown, including:
• UNI vs ETH price chart comparison
• On-chain stats, dominance shifts, and upcoming catalysts
• Why I believe UNI is set for a breakout back toward new all-time highs
⸻
Like, comment, and follow for more deep-dive crypto breakdowns and technical setups.
#Uniswap #UNI #Ethereum #ETH #CryptoAnalysis #DeFi #TradingView #AltcoinSeason #PineScript #FundamentalAnalysis

UNI Sell/Short Setup (4H)The overall structure in UNI is bearish, considering the recent CH (Change of Character) observed in the swing.
The price is currently below the resistance line, and if it approaches the premium zone of the previous minor wave, we can look for sell/short positions based on UNI’s overall outlook. The zone where we are interested in entering a position is marked with a red circle.
The target can be the green box.
A daily candle close above the invalidation level would invalidate this analysis.
For risk management, please don't forget stop loss and capital management
When we reach the first target, save some profit and then change the stop to entry
Comment if you have any questions
Thank You

UNI. Movement.You can call it sideways movement or a movement in a global ascending channel - imo, both options will be valid for BME:UNI you can expect 60% up move - to the middle of the channel

CETUS Hack Giving Opportunities Within SUICRYPTOCAP:SUI SUI is one of the fastest growing L1 chains. Previously extreme intra SUI dominance within swapping volume by KUCOIN:CETUSUSDT CETUS. This hack is a direct threat to the confidence of not just the application but the chain itself just like Ethereum was exposed during the MakerDAO hack.
Volume market wants to know their funds are secure to certain degree and predictable. Volume flow is more than fine with centralisation, esp with low barriers. Should the deposits be mostly secured and exploit fixed then it can bring confidence roaring back not just to CETUS but more importantly, SUI.
CETUS dominance within SUI is falling to rising applications. My favourite is Bluefin with its low barriers to account creation like google login. KUCOIN:BLUEUSDT BLUE has rising dominance within SUI volume market.

UNIUSDT: A Massive Bullish Move Loading… or a Trap?Yello, Paradisers! Is UNIUSDT finally gearing up for a major breakout, or is this just another fake move before a deeper correction? Let’s break it down.
💎UNIUSDT is currently trading within a descending channel, increasing the probability of an upcoming bullish move. The key support zone is holding strong, and we might be witnessing the early signs of a double-bottom formation—a classic reversal pattern.
💎However, confirmation is everything in trading. To increase the probability in our favor, we need to see: Bullish divergence, Bullish I-CHoCH (Internal Change of Character), Bullish reversal patterns such as a W-pattern or inverse head and shoulders from our support zone.
💎If UNIUSDT retraces further, we expect a bounce from the strong support zone—but again, we must wait for clear bullish confirmations before taking any positions.
💎The invalidation level? If price breaks and closes candle below the strong support zone, the entire bullish setup gets invalidated. In that case, we wait patiently for better price action before considering any new trades.
🎖Patience and discipline are key, Paradisers. Many traders will get trapped in bad positions, but those who wait for the right confirmations will be the ones making money. Trade smart & stick to high-probability setups only.
MyCryptoParadise
iFeel the success🌴

UNI – Long Spot Trade Setup Following Breakout and RetestUniswap (UNI) has recently broken out of resistance and successfully retested it as support, forming a strong bullish structure. If Ethereum (ETH) continues upward, UNI is likely to benefit from correlated momentum, potentially kicking off a larger rally.
🔹 Entry Zone:
$5.46 – $5.95 (post-breakout retest zone)
🎯 Take Profit Targets:
🥇 $7.50 – $8.00
🥈 $10.00 – $10.50
🛑 Stop Loss:
$4.10

Uniswap Perfect Bullish Chart With New ATH Potential Late 2025Uniswap has a chart with perfect symmetry. It is a beautiful chart, well organized, and it shows a very strong potential for a new All-Time High to be hit later this year or in early 2026.
The market bottom happened in November 2020 for UNIUSDT. This bottom low marked the start of the 2021 bull market which is clearly visible on the chart.
The bull market in 2021 produced a wave totaling 2,462% growth, that's more than 25X.
The same low/level/support that was activated in November 2020 and launched the previous bull market wave was again activated in June 2022. This low marked the 2022 bear market bottom and from this point a long-term consolidation period (sideways market) developed, with higher highs and higher lows.
There was a major low in August 2024 and the last one, April/May 2025. The current low can be equated to something similar to November 2020, from this point on, we will not see small waves as in the past three years but a major bull market. Like 2021 but much bigger. It will be huge.
A new All-Time High is not only possible but very easy for this pair, very easy...
The action will push prices beyond what is shown on this chart.
Timing is great. Prices are great. This is an easy buy and hold.
After you buy, the market will grow for months and months and months before peaking. You can't go wrong with bottom prices. The time to buy is now, when prices are low.
Namaste.

UNI Uniswap Breakdown. Support Hit but is there More Downside?🔎 I'm currently analyzing UNI/USDT (Uniswap paired with Tether) and observing a clear bearish trend 📉 on the daily timeframe. Price has recently tapped into a key support zone 🟦, and we’re now seeing a short-term retracement from that level.
However, with Bitcoin currently overextended ⚠️ and showing signs it may pull back, there's a strong possibility that UNI could continue to drop if BTC rolls over. Correlation plays a major role here. 📊
In this video, I break down essential elements of the chart:
📌 Market Structure
📌 Price Action
📌 The prevailing Trend
📌 Key Support & Resistance Zones
You'll also hear my personal take on a potential trade setup — if price action continues to unfold in line with the criteria discussed.
📚 This content is for educational purposes only and is not to be considered financial advice. 🚫💼
UNI Price Action Breakdown. Support Hit but is there More Downside?

UNI — Time to Accumulate? A Clean Long-Term SetupUNI is the native token of the Uniswap DEX — and it's finally back in our interest zone.
After a brutal 70% correction from previous highs, price has retraced into a key accumulation range between $3.60 – $6.76.
This isn’t just another alt — UNI is a fundamental token that arguably deserves a place in every long-term portfolio.
Spot entry around $5.50 looks reasonable, with higher timeframe targets at $10.35, $17.03, and $19.47.
No overtrading here — just a clean long-term thesis. Accumulate, sit back, and let the narrative unfold.
More thoughts in my profile @93balaclava
Personally I trade on a platform that offers low fees and strong execution. DM me if you're interested.

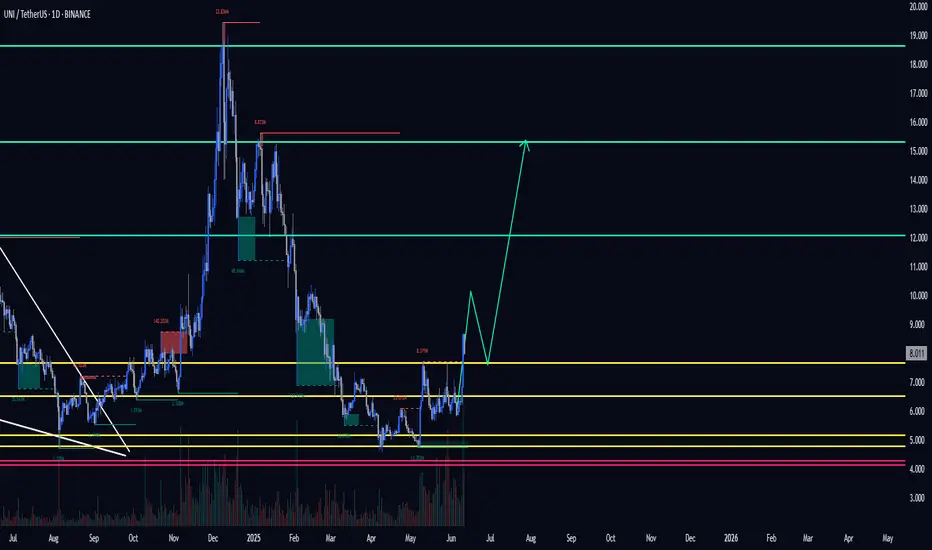
UNI Trade Setup - Strength After Liquidity SweepUNI has swept underside liquidity and is now holding strong. If price consolidates above $7, we’ll be looking for local lows to form, setting up a medium-term move higher as broader markets push into resistance.
🛠 Trade Details:
Entry: Around $7 zone
Take Profit Targets:
$10.50 – $11.00 (First Target)
$14.50 – $15.00 (Extended Target)
Stop Loss: Daily close below $5.5
Waiting for market confirmation before positioning for the next leg up! 📈🚀

UNIUSDT Buy SignalUNI Buy signal on H1 chart. This coin has strong bullish outlook on all Timeframes. Risk reward 1/3
