UNI USDT SHORT AND LONG POSITIONUNI/USDT M W D AND 4 H LINES
uniusdt long and short postions
uniusdt long and short postions
uniusdt long and short postions
UNI

MY UNISWAP PRICE PREDICTION IDEA 2022My uniswap price prediction idea for 2022 i am long now in the uniswap

UNI/USDT and other Defi LONG for long termAnother long term trading idea:
UNI/USDT and other Defi LONG for long term
Targets and entry on chart.
Enjoy your profit

UNI Uniswap Price PredictionGrayscale expressed concerns over the potential impact on the Ethereum Merge, especially on tokens that run natively on Ethereum:
The Merge may lead to a fork that might have unexpected and unfavorable outcomes and a scenario where stablecoins and tokens locked in smart contracts might not be redeemable.
Token and stablecoin holders might panic and start liquidating their holdings.
In this context, price target for UNI Uniswap is $3.55.
Looking forward to read your opinion about it.

UNI (falling wedge)UNI / USDT
Classic falling wedge breakout
As long as price is holding above resistance line
Priority is bullish

uni/usdt 2hr rsi oversold in multiple time frames, hit support, looking to long for a swing trade, tight stop loss, and take profit at last resistance, if bitcoin recovers so will this, they move very closely together.

📊 UNI accumulate power before PUMP. 2 entry points!Hi friends! UNI is the most profitable altcoin of the last 1-2 months. I think this trend will continue and we will see new highs soon. This crypto platform keeps growing and a lot of buyers will support and push the price higher, when the pump happen.
🚩 Now the price of UNI is inside the $6.75-7.30 support area.
📊 Here the preconditions to open a long:
🔥 false breakout of the local lows which create after this local dump. The price need to go lower the support area to activate the stops of long traders.
🔥 growth of the volume confrirms us that during this price movements a lot of traders buy UNI to go long. Especially, this precondition show us the whales pressence which want to buy more UNI so they trap long traders in such way.
🔥 bullish BTC help ot UNI but all alts to reach their new highs. As i said before, UNI is te most profitable among other altcoins so pay you attention to this coin.
🚩 DOM and Footprint scalping tools help me identify the whales buy orders and open the trade with them during this false breakout. In this case i can set short stop loss and get the best risk to reward ratio.
📊 The targets:
1. $10 - the closest key level, even number and big resistance. If the price break this level up, it will be great possibility to add to your position or open another good long.
🚩 But if i will see the price weakness and such things as false breakout of this level, i`ll realize my profit and try to find the entry to short trade. Also DOM and Footprint show the huge whales sell orders.
2. $13 - the key level
💻Friends, press the "boost"🚀 button, write comments and share with your friends - it will be the best THANK YOU.
P.S. Personally, I open an entry if the price shows it according to my strategy.
Always do your analysis before making a trade.

UNI Forecast 📊 (H4)Whats Up Retail Whales 🐋
Before we start to discuss, id be so glad if you share your opinion on this post's comment section and hit the like button if you gained value!
#UNI/USDT
- EQL were manipulated before price broke structure
- Price left a strong imbalance that is now being filled
- Multiple Liquidity lows were taken as inducements
- Expecting price to hold our 4Hr Whale Block for a LTF Entry
- HTF bias, we could see the EQH tops purged
- If demand fails and holds below we will shift bearish again.
Alerts set on 4Hr Whale Block
Remember we are trading human emotions and probabilities
Hope you enjoy the content we create, You can support us with your likes and cheers 🙏🙏
❗️Attention: this isn't financial advice we are just trying to help people with their vision.
HooRaa

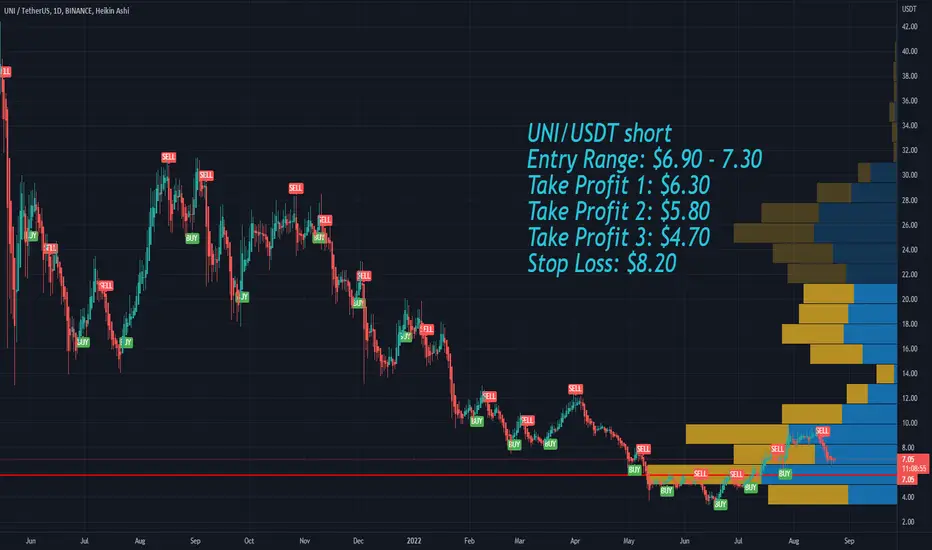
Uniswap UNI short Entry Range, Take Profit and Stop LossUNI/USDT short
Entry Range: $6.90 - 7.30
Take Profit 1: $6.30
Take Profit 2: $5.80
Take Profit 3: $4.70
Stop Loss: $8.20
UNI UPDATEI think UNI has been an easy chart to guess and follow so far.
As I suggested in my previous update - after losing the trendline and the support at $8ish area. Price retested the area and gave a perfect entry for a short. (hope someone out there took the chance to make some money on this)
Now approaching another strong support area around $6.2 - $6.5. I'de be keen to see the reaction there. I think it would be a nice opportunity to long. Possible target around $8 again. Bu I would keep an eye open until price moves over $7.3
Lose the &6.2ish and price is going to the next level of support.
Obviously keep and eye on the big guy BTC to see how things are going.
As the decline started to possible new lows, we want to see LH and LL forming.
if you decide to long.. USE STOP ORDER! always play safe! ;)
DO NOT FOLLOW MY MOVE BEFORE YOU DO YOUR OWN RESEARCH, THIS IS AN IDEA - NOT A FINANCIAL ADVICE!!

UNIUSD CONSOLIDATION BREAKOUT Looking like we are going to have a lovely bearish move you do not want to miss, we are currently in a consolidation period and waiting for a breakout of this area for which we will then short

UNI UPDATETrying to figure it out?? yeah me too..
So it's all relevant to what the big guy BTC will do.
Price is nicely moving within the range for the last few days.
Some really good opportunities for scalping there. Did you take advantage of this so far?? ;)
As we are approaching the range low again it is important to see if the price will bounce. Break the low and lose the trendline and we are probably heading to the next line of support i.. (if you want to short wait for confirmation)
if price starts moving up keep an eye on the EQ and then range high.. No idea if it will go for another heigh or double top. Will have to wait and see. TBH UNI is looking a bit tired in comparison to other alts but who knows.. (if you want to go long keep an eye on BTC as well before you jump in).
Price action has been really bad today... be cautious
Do not follow my moves before you do your own research, This is an ideas not a financial advice.. Play Safe!!

UNI.UsdT (Y22.P3.Video1). More to goHi All,
Still bullish and probable that we have more to go.
We review the current levels to trade and the criteria to do so.
With also some background explanations as to how we got here.
Please give me a like and share,
All the best,
S.SAri

UNIUSDT can go higher after the breakoutUNIUSDT can go higher after the breakout. The price has formed a Bullish pattern and the last large green candle indicates that the bulls are in control.
💎 UNIUSDT
🔵 Entry zone 9.07- 9.76
🟢 TP1 11.60
🟢 TP2 13.90
🟢 TP3 16.10
🔴 SL 7.97
Good Luck 🎲

Trading opportunity for UNIUSDT UniswapBased on technical factors there is a Long position in :
📊 UNIUSDT Uniswap
🔵 Long Now 9.41
🧯 Stop loss 7.45
🏹 Target 1 11.60
🏹 Target 2 13.90
🏹 Target 3 16.10
💸Capital : 1%
We hope it is profitable for you ❤️
Please support our activity with your likes👍 and comments📝

Bitcoin Trend Analytics August 12UNI has jumped out of the downward channel and initially entered consolidation. It has come near to the edge of heavy resistance and trying to breakout and expand the consolidation range.
Although coming out of the downward channel, UNI has not formed a short-term bullish channel.
Short-term bullish, mid-term consolidation
The support of the short-term bulls is at $8.02; $6.16

Slowly but so strongOn daily chart
BINANCE:UNIUSDT has broken the resistance at 6.0 and went up to 9.6.
Next target at 12.25 with fibo clusters
+ 0.5 Fib Retracement of higher wave
+ 1.618 Fib Extension at 3.3
* Key Level at 12.25
* Invalidation Level at 12.25
Let's wait and see

#Uniswap Rises 180%, UNI may expand to retest $14Past Performance of Uniswap
Uniswap is currently up 180 percent from 2022 lows, inching higher as the crypto tide shifts to favor buyers. UNI is within a bullish breakout formation, adding 10 percent in the past 24 hours to confirm gains posted on July 27. From the daily chart, the odds of UNI further expanding and breaking higher above July 2022 highs remain high.
#Uniswap Technical Analysis
From the daily chart, UNI prices have strong support at the middle BB, bouncing from the dynamic support level and closing on retesting July 2022 highs. The primary resistance is around $9.7; buyers could clear this level, rising to April highs at about $14. Considering this possibility, traders may find entries to buy the dips with primary support at $8 with targets at $14 in the medium term. Any shift in momentum, forcing prices below this week's low and the 20-day moving average, may see UNI dump to $6.
What to Expect from #UNI?
Traders are confident, and UNI holders expect more gains in the days ahead. The rejection of bear pressure and the explosion of prices on August 10, following through on July 27, is massive for Uniswap. Based on the current setup, UNI could have more headroom in the subsequent session following steep, crashing losses in H1 2022.
Resistance level to watch out for: $9.7
Support level to watch out for: $8
Disclaimer: Opinions expressed are not investment advice. Do your research.

$UNI - Hidden Bearish Divergence $UNI - Hidden Bearish Divergence
Last time when this got executed, UNI went down 70%.
Let's see how much down it goes or even if this gets execute.

UNI Update - Moving UpFollowing my previews idea. UNI had a good reaction in the box with a nice bounce.. I've marked some areas that I think price might find some resistance.
Do not follow my moves before you do your own research, These are ideas not financial advice,

UNI up 83% after bull signal - Now 30% correction incoming?UNI pumped 83% after the bullish Supertrend Ninja - Clean signal (green vertical line on the background). Finding resistance from the grey block. In a possible bearish/correction scenario UNI might possibly drop 30% to 5.50 USD, completing wave 5 of the Elliot Wave (blue dotted lines).
UNI is still in the Bullish Zone of the Ichimoku Cloud. The RSI is at 61, but I expect it to fall back into the range (40 to 60). RSI Brown is at 55. If we take a look at the Average Directional Index ( ADX DI), its starting to be bearish, as the green line is pointing downwards. Currently UNI is above its middle Bollinger Band, Band Basis 20 Period SMA. While it is below the LSMA .
Remember to always take profits and use proper risk management!
Thank you for reading.
Namasté 🙏
Disclaimer: Ideas are for entertainment purposes only. Not financial advice. Your own due diligence is highly advised before entering trades. Past performance is no guarantee of future returns.
What Indicators Do I Like To Use:
I am using the "Supertrend Ninja - Clean", which is a trend-following indicator (Green and red vertical lines on the background). When the background of the candlestick closes green (vertical line). It indicates a possible bullish (up)trend. And red for possible downtrends.

💎 UNIUSDT: 524.39% Profit Potential in Next 6 Months💣💣💣💣last 2-3 weeks we seen huge buying in UNI coin, in upcoming months its to going pump very hard.
entry and targets are given on the chart. Treat this idea as long-term investment
please Like and comment if there are any queries.
#bitcoin #altcoinseason #altcoin #altnews

Trading opportunity for UNIUSDT UniswapBased on technical factors there is a Long position in :
📊 UNIUSDT Uniswap
🔵 Long Now 9.00
🧯 Stop loss 7.45
🏹 Target 1 11.60
🏹 Target 2 13.90
🏹 Target 3 16.10
💸Capital : 1%
We hope it is profitable for you ❤️
Please support our activity with your likes👍 and comments📝
