UNI goes downIt seems that we will have a fall to the specified support level by meeting the downward trend line.
UNI

UNIUSDT OUTLOOKUNIUSDT lookslike making HnS pattern
GoodLuck guys !
invalid if price break green line
DYOR

UNIUSDTThe conditions of the BINANCE:UNIUSDT are as follows:
Over the past 50 days, we have witnessed an uninterrupted 85% price growth.
Most of the resistance lines we assumed for UNI turned out to be weak, and the price easily surpassed them.
However, now we are approaching the 0.786 Fibonacci retracement level, which is located at a price of $6.75. In my opinion, this point, or $7, could potentially lead the price back to $6, and then $5.30.
At the $6 price point, we have strong support. However, between $5.80 and $5.35, there is a fear value gap(FVG), which could guide the price to those points and cause a price drop.
Also, in the 4-hour timeframe, we are witnessing a divergence in the RSI (Relative Strength Index) indicator, which can be an initial signal of a trend reversal.
But we need to wait and see how the market reacts to the $6.75 price level.
Ultimately, everything depends on the overall market conditions.

UNIUSDTUniSwap is in a good position to sell, the first target is -6%, the second target is -14%.
good luck

UNIUSDTAccording to chart after two unsuccessful times for breaking up the broken support its time to take action on short position.
I'm bearish at the moment.

From Support to Surge: A Look at #UNIUSDT's Ascending Channel💎 Paradisers, the mid-term price action for #UNIUDT remains optimistic, as we continue to observe a pattern of higher highs and higher lows. What's more, #UNI has recently retested and rejected the vital demand zone near $5.7 for the third time in a row. It's evident that the bulls are holding their ground, and this could lead to a powerful surge shortly.
💎 We must also consider the bounce off the 50% Fibonacci retracement level, intriguingly situated right in the supply/demand area. Furthermore, #UNI continues to trade above the 200 Simple Moving Average on the 4H timeframe, once again displaying its bullish intentions.
💎 In terms of immediate resistance, the peak of the ascending channel could be the first area for profit-taking. However, if the price breaks above the channel with robust buying pressure, we could witness a much more potent trend in the upcoming weeks.
💎 Of course, this bullish outlook would be negated if the bulls fail to defend the demand zone, but as of now, #UNI appears quite bullish. Stay tuned for more updates and happy trading, Ladies and Gentlemen of ParadiseClub!

long UNIBME:UNI bounced off the ascending trendline. Bullish movement to resistance level at $6.64 is expected to happen.

Uniswap UNI price price is accelerating, how long will it last?It seems that in early June, the UNIUSDT price did manage to break out of the prolonged downward trend.
Well, we're keeping our fingers crossed that buyers will be able to accelerate the growth even more. Buyers have a "difficult path" ahead of them, as there are strong liquid zones above, where there will be many people willing to sell their UNI, which is lying around in their crypto portfolio and weighing it down with its price drop.
The first critical level from above is $7.50. This is where the first "serious struggle" between buyers and sellers will begin. The outcome of the battle will determine which route the UNIUSD price will take next - white or blue.
One way or another, the medium-term target, where we believe the price of the Uniswap token will sooner or later reach, is in the range of $12.25-13
_____________________
Did you like our analysis? Leave a comment, like, and follow to get more

short UNIBME:UNI broke through the ascending trendline. Decline to support level at $5.69 is expected to happen.

UNI target 9.8~10.61D time frame
-
UNI broke the falling wedge structure.
Retesting is good to take entry and set trading plan.
TP: 9.8~10.6
SL: 4.515

UNIUSDT: Potential Trend Reversal Amidst Breakout and Bounce.💎Recently, #UNIUSDT successfully broke out of the descending channel and surpassed the supply zone, confirming a shift in market dynamics. Subsequently, the price underwent a correction and achieved a clean bounce off the 61.8% Fibonacci support level, indicating a potential shift in the trend from bearish to bullish.
💎Currently, #UNI is positioned within the demand zone, which serves as a crucial starting point for the next upward swing and potentially significant price increase. To assess the potential upside, we turn to the Volume Profile and Fibonacci indicators, which highlight three key resistance levels to monitor. The nearest resistance lies approximately 20% above the demand level, while the final resistance is situated around 35% higher.
💎However, the realization of these gains hinges on the avoidance of a new lower low, specifically, a daily close below the critical support level at $4.74. It is important to note that the market may enter a consolidation phase, characterized by range-trading, lasting for another week or longer. While the probability favors an eventual upside move, Paradise Club Members must remain patient.

✴️ Uniswap Clear Bottom Signal, Long-Term Higher LowOk... Let me explain my thinking to you, my dear friend, behind this chart.
✔️ Fundamental analysis
Uniswap is a DEX and that's a point in favor.
Since all the CEX are under attack, people are starting to appreciate the benefits of DEX but that's not all, the chart is what really matters because fundamentals can be good and prices go down, fundamentals can be bad and prices go up; It is more based on market cycle rather than everything else.
But being a DEX is a point in favor specially in 2023 now that the Cryptocurrency market is 14 years old and growing.
Many people have experience and love to diversify, for security, for protection, for ease and peace of mind. Great choice, this is wise.
✔️ Technical analysis
The bottom signal is absolutely clear in June 2022 with the Inverse Head & Shoulders, or simply three drops before a recovery takes place.
Fast forward 1 year, the biggest attack in the history of Cryptocurrency and Uniswap produces a strong red candle 10-June and starts to recover right away.
In the past we had this complex recovery pattern, in the present we get a simple "v shape". The law of alternation once more.
We have multiple days green, straight up and a year long higher low.
Last year the June bounce lead to 193%.
Since we have a higher low in place, this time it can be better.
I want to buy this one with a bunch of X... If you can do it, make a plan and go ahead.
Namaste.

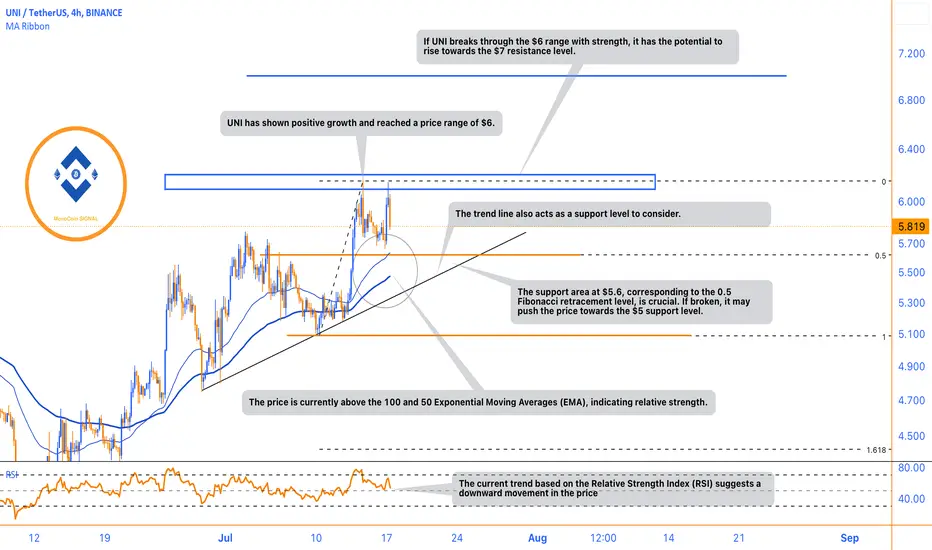
UNI Price Trends and Potential Support/Resistance LevelsUNI has experienced significant growth and its price has reached the $6 range. However, based on the Relative Strength Index (RSI), there is currently a downward trend in the price. It is worth noting that the price is still above the 100 and 50 Exponential Moving Averages (EMA), indicating a relatively strong position.
If UNI manages to surpass the $6 range with strong momentum, it has the potential to climb towards the $7 resistance level. On the other hand, the support area around $5.6, which coincides with the 0.5 Fibonacci retracement level, holds crucial importance. If this support level is breached, it could lead to a decline towards the $5 support level. Additionally, it is worth considering the trend line as another potential support level.
Uniswap outperforming today Uniswap is exhibiting exceptional performance today, showcasing a bullish breakout and setting its sights on reaching the 6.5 level. The probability of achieving this milestone significantly increases if we manage to surpass the critical threshold at 6.22. However, if we fail to maintain stability around the 6.0 mark, it would be wise to anticipate a support retest at the 5.7 level. NFA

UNIUSDT 1D LONG📈Hi all. UNI is in strong support. I consider a long position during a breakdown/retest of a trend line. Either a set to the spot now and from the lower support. Goals on the chart.

UNI Uniswap Double Bottom on a Falling WedgeIf you haven`t sold UNI when Apple blocked Uniswap Labs’ mobile crypto wallet:
Then you should know that UNI (Uniswap) has recently formed a double bottom pattern within a falling wedge, indicating a potential bullish reversal in the near term. The double bottom pattern is characterized by two distinct lows at approximately the same level, followed by a potential breakout to the upside. When combined with the falling wedge, this pattern suggests a convergence of support levels and diminishing selling pressure.
Considering the formation of the double bottom on the falling wedge, UNI could be poised for a potential price target of $5.70. This target represents the projected upside that could be achieved if the pattern unfolds as expected.
Looking forward to read your opinion about it!

Uni Breaking Out Seems Like Getting Ready For Solid Recovery Breaking Descending Broadening Wedge In 3 days tf incase Of Successful Breakout Expecting Massive Bullish Rally Towards 20$

TRADE OF THE DAY | UNI is looking like a 11% drop after reliefTRADE OF THE DAY | UNI is looking like a 11% drop after relief
UNI is shaping up for a heavy drop after a pretty decent relief rally looking like people heading to DEX's in fear of the SEC attack on CEX's. Although it does not look like it will sustain and the drop will be quite hard. A big bearish divergence along with the trendline break on the RVI are big triggers here.

UNI’s Downward Trend and Potential Bullish ReversalDue to ongoing sales pressure in the market, UNI experienced a downward trend and reached the support level of $3.62. This support level coincides with the 0.5 Fibonacci level on the monthly time frame, indicating a strong demand area. Additionally, there is a potential formation of a double bottom pattern on the monthly chart.
If more than 50% of last week's bearish candlestick is recovered and a strong bullish candlestick forms this week, it suggests the possibility of changing the trend to a bullish state. Currently, the price is back within the descending channel, but with the emergence of demand, it could potentially rise towards the first target, the midline. However, breaking the resistance at $5 is crucial to escape the descending channel. Such a rapid turnaround may influence the trend for a period of time.

UNI CAN DROP MOREHi, dear traders. how are you ? Today we have a viewpoint to SELL/SHORT the UNI symbol.
For risk management, please don't forget stop loss and capital management
When we reach the first target, save some profit and then change the stop to entry
Comment if you have any questions
Thank You

UNI 22% upside incoming ?!! 💎 #Uni has shattered its long-standing support level and the lower limit of a triangle formation, indicating a likely extension of the bearish trend 📉
However, there's a crucial element to take into account. The price discovered support on the descending trend line, coupled with a bullish divergence on the MACD indicator, hinting at a possible rebound 🔼
We're looking at two potential scenarios:
1️⃣ A consistent drop following the breach of the last low
2️⃣ A pullback to the trend line prior to recommencing the downward trajectory
Remember, ParadiseFamilyVIPs, in the ever-evolving crypto landscape, staying informed and adaptable is key. Stay tuned for more updates and happy trading!

UNI looks primedAfter a 22 months long bear market UNI finally breaks the market structure.
Deviation -> Reclaim -> Consolidation -> Breakout
To me it looks good. Targeting the red area.

Downtrend Alert: UNIUSDT Falls Below Key Support Level💎 Yesterday, #UNIUSDT experienced a significant break below a long-term support level, which also coincided with the bottom of a triangle formation. This break signals a continuation of the long-term downtrend, although there are several important factors to consider.
💎 After the triangle break, the price found support at the downtrend trendline, accompanied by a bullish divergence on the MACD indicator. These factors suggest the possibility of either a strong or a small pullback to the upside. However, it's important to note that the break below the triangle formation is a bearish signal, indicating that the downtrend is likely to continue.
💎 Currently, we outline two potential scenarios for the downtrend's development. The first scenario is a break below the recent low, followed by a consistent drop in price. The second scenario involves a pullback, potentially reaching the downtrend trendline, before the downtrend resumes.
💎 To change the overall trend, #UNI would need to break above the long-term resistance level. Only then would we consider a strong bullish case.
💎 Our ParadiseClub members can rely on us to monitor these developments closely and provide timely updates on any significant changes.
