UNITY

$U Ready to bounce?After a tremendous uptrend right after it's IPO, Unity was sold off after ER, probably consolidating and preparing for a another move up. If the gap above is reclaimed, and if both key fib levels end up working as support, then last week's Friday candle was the golden cross, ready to long $U again. Need stronger confirmation on the bounce, but this could be the end of wave C, ready for wave 1.

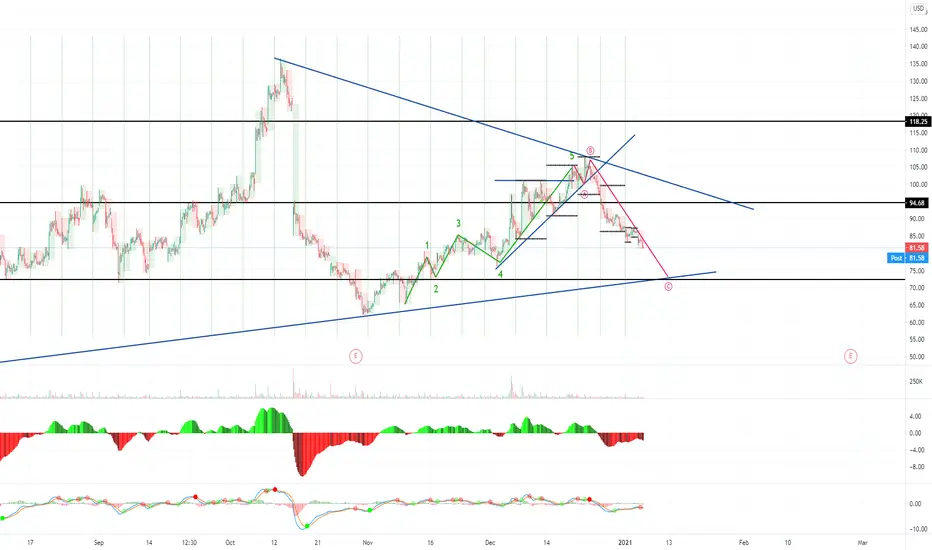
Unity - Trendline No:1 or No:2 🤷♂️🤔-After an interesting week full of good news, Unity settled down around $125 (-15%). Although EPS $(0.10) Beat $(0.14) Estimate, Sales $220.30M Beat $204.23M Estimate and ARK purchased shares of U after drop, it didn't show us a come-back immediately. For a week already it has been testing the deeper deeps with slight drops.
-We came up with two trendlines for you, our followers! Our company believes in the first trendline and we are very bullish on this stock. We bought 4 ITM call options and bought some stocks as well on the very first day of the drop. We see the current price as a good entry point.
-In case if the downtrend continues, the potential support points would be: 99.27, 93.89, 87.10, and 82.15.


Unity Software - TrendlineHi Everyone!
One of our top picks for up-coming weeks is Unity Software Inc (U) with a surprising 14% drop on Friday. Here we tried to show a trendline for a 6 month period where we clearly can see that Unity followed it for a while, then it been overbought and now it is coming back to its normal flow. We can confidently say that an entry from here would be safe.


Is $CRWD ready for an $ABC correction to $195Is $CRWD ready for an $ABC correction to $195
CRWD is definitely a leader in its space but this run looks a bit extended and exhausted along with a potential corrective wave to $195.
Use options to define risk as premium paid.
Suggested options to use: Feb 5 Weeklies $200 put trading at $4 a contract.


Unity hits $160 before Jan 7It will test the new resistance although most of people think it is overvalued.


$U I will take it if it comes to $130 and $120 #WAITANDWATCH$U I will take it if it comes to $130 and $120 #WAITANDWATCH

Unity 28/29% ruleI like Unity Stock, looks like its an amazing software been use for almost all the VR games and experience. Mobile games and even game on blockchain like The Sandbox Game.
I only see a good future for the company.

$U Rising Wedge | Short down to $100Love the company but $U forming a clear rising wedge, volume declining as it finds resistance at $130. Looking for $100 and will go long there.
BTO December $100P avg $1.

Ascending Triangle trading opportunity$U has formed an Ascending Triangle with valid breakout.
risking 5% for 20% upside potential is a great deal to me.
###NOT FINANCIAL ADVICE###

BUY STOCKS NAS100 ANALYSISAs u can see on the day chart this flush can continue down to 9900 and than retrace back in to the bullish mode, it could also retrace from now hitten support and that mean, now is the best time to buy some stocks. Be carefull and watch the support if a are trading with leverage but when u investing its safer.
Hope this perespective will help you with trading stocks! If it will give me a like and share your toughts with me and other traders in comments!

GOOLLLDDDDD!!!!!Interesting times ahead with all the talk of the next big recession on the horizon and many markets reaching ath's and taking big dives, governments falling deeper and deeper into debt, housing markets long over due for a downturn and the banks playing all sorts of buggery on interest rates.....
Its a little known fact that GOLD and other rare commodities can be a safe haven hedge during economical crisis, silver, oil, uranium, lithium etc
Gold has rising almost 30% since its retracement low late 2015 and is now IMO at a key level of break out, not just from an overall down trend but a key level of resistance thats failed to break 5 times since mid 2016.
As the global economical climate draws closer to boiling point i wonder if this will be the catalyst to cause a break out?
40% + push back to previous ATH in sep 2011 after the run up from the last recession, some 600% from the very start of the tech boom or ......dot.com bubble...
Interesting times ahead, but gold not just being a rare desirable metal but having many use cases in computer circuitry, jewelry, medical and aerospace engineering makes it not just a speculative market but something of real use case giving it an intrinsic value unlike...FIAT CURRENCY.
change my mind :)

BTC/USD on the dailySome interesting daily candles over the last week has had me changing my trading strategy a number of times now.
At first i was expecting a descent retrace from that 4200-4400 area that would potentially kickstart a new down trend, but what we saw was a very harsh sell off which through what i was seeing out the window to some degree.
Over the next few daily candles as we where hold up in the range we saw some nice alt action which has been great to trade, some long wicked candles on btc but still closing with small bodies.
A wick down touch on the 618 on the overall uptrend which is expected at first.
As that consolidation printed its 7th consecutive indecisive candle i could see a descent move coming up, and although my gut was telling me down IMO it was still a bit of a coin flip with the previous markets movement so i stayed out and let the market tell me what it want to do, in saying that i missed out on a descent short but thats ok "cant win them all".
Again price being held above the 618 over all retrace and we have just been given a bulish engulfing today which is a bullish sign, HOWEVER imo its a bullish sign inside a down trend that had not finished or was showing signs of a reversal.
Im seeing a few different outcomes here and will base my trade as they play out, if this bullish reversal continues with some more organic volume (which it doesnt have a lot of right now) then a push to retest that 4200 zone may be on the cards.
Right now the 38 fib line is holding price down so if there isnt the numbers in the bulls we may see a failed reversal and a rejection back down to a lower fib level potentially the 786 area.
if the 38 level breaks up the next level of resistance will be around the 236 mark at about $4000 (also a psychological round number) again if there is a rejection here i can see us testing that 618 once again.
At the moment im going to be playing the smaller time frames and looking for signs of a break in trend but for now im happy to stay in btc and let it walk its way back up to 4200 to test that high.
I wont be counter trend trading on leverage against what i believe is still a down trend in play.

EOS update and break down on the 4hr EOS didnt want to give us another entry on the daily and smashed through out daily supply zone, how ever on the 4hr we got a noticable pull back and managed to get a trade in as it broke through and retested on the previous supply zone.
price spiked to our target at .00100 to take profit for almost 90% on 10x from our entry.
strong rejection at this supply zone now although imo this resistance here is quite week, im not sure what more eos has to give as the daily is quite parabolic and has spat out a clear bearish divergence.
we could see a fomo push but imo technicals are pointing to a larger retrace incoming.
Il now looking on the smaller time frames for a double top rejection to confirm a possibly short entry.

EOS/BTC trend is getting exhaustedEOS just keeps pushing but this trend imo is going to come to an end soon enough, was short off that small time frame double top and took small profits as it turned back up, was looking for another short entry if it was rejected at that level again but smashed through and tapped the next level off resistance.
Divergence building now on the daily if this rejection holds, short term retrace back to 8400 area before most likely trying to crack this level again.
if it can break above this supply zone the next target in mind would be 10000, with buy stops over supply, still a 10% trade between each order block.
If the rejection is strong here at a double top or fails to make a new higher high and kicks off a down trend im looking at 6800 for a potenial target for a short or re entry for a bounce.

ETH/BTC/H19 big trade huge wins, lets see what else its gotThis was another one we covered in our group the other day, seeing a potential bullish pattern as price was being squeezed into supply, it was only a matter of time before the bears gave up and let it go.
2 options we had for this trade was lucky dip longs off trend and pay close attention for the break out...ORRR use buy stops and catch the break.
Either strategy would have worked as we suggest this move to be a fairly aggressive move to the next supply zone which we not only tapped but have eaten through it over the last day.
Profits taken around 9% x leverage but now we wait for a pause, ideally a retrace to the 50-618 giving us another opportunity to not only trade back to previous structure but im tipping busting through this supply to the next level around .040, this supply being heavily compromised now with all the breaching with market structure.
What i dont want to see is a ranging consolidation here between the top and the 38 retracement, if this walks sideways for to long confirming a distribution zone we could be set up for a coin flip depending on overall market sentiment and more so emphasis on BTC direction, in other words could go up could down....
either way im thinking the break in this supply will be another fairly impulsive move to the next target around 10% from the retracement area.

LTC/BTC potential down ternIm going to do 2 charts on LTC here and there works for the H19 chart as well, this one is based on the current supply level not breaking, the next chart will be based on the supply being broken
Ltc has had a really good run with plenty of trading opportunities, its gearing up again on the smaller time frames for a push back to this top which is previous supply levels.
A fail to break this level with a clear double top and looking for bearish divergence on the CCI i can see this rejection being a descent down turn.
ideal strong demand between the 50/618 so this will be the ideal spot for a bullish bounce to test those levels again at .01260 ish
if we break though refer to next chart, but if the volume is not there it will most likely form a bearflag following a further drop the the 786, and most likely another bearflag drop back to a 100% retrace.
In a long at the moment with that double top as my area of interest to flip the trade and go short to the 50%
risk management is key, have a plan for both ways, buy stops if we break above or bag flip to ride it down.
