EOS/H19I made a mistake yesterday posting my EOS/BTC chart from binance so just doing an update now with the H19 bitmex chart.
as perviously mentioned we had a double top on the 1hr chart and clear bearish divergence on the 4hr, shorts opened on the second touch.
We also found the short term uptrend break as well giving a second confirmation.
price trending down the path nicely now but expecting a small hold up here with potentially a small retrace to the 7850 area forming a small bear flag before dropping yet again.
will update this daily.
UNITY

ICX/BTC short term trade opWe have had a few solid trades off ICX in the last week or so, failed attempted to set up for EW recently with a bearish divergence formed on the closes, and can see a gartley harmonic pattern brewing.
Ideal drop to the 786 retracement over all puts a good bounce possibility at around .0000550 btc
We always teach our members to be conservative when trading harmonic patterns specially in crypto markets, 38 and 50% is ideal targets the 618 can some times be a real stretch of a target specially with current market situations.
at the same time the .0000585 level could prove to be a hold up on this down trend and may not reach out entry position, patients is the key here, if it doesnt get there it doesnt get there...move on.

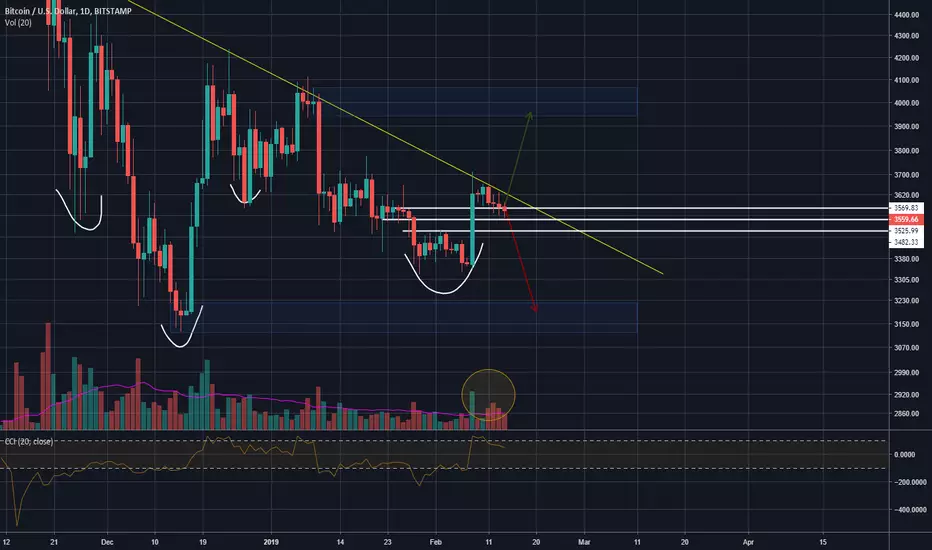
BTC/USD Daily analysisAgain not a lot to report from yesterday, we still have had any price action even after the futures close which was interesting, historically we normally see some movement in anticipation to the close and on the close we get the biggest action but yesterday we had barely anything....I see this as kind of bad, a very stale market imo can be bad in the short term.
Todays daily has wicked down and bounced on the 50% which was kind of an expected move to test those fib retracement levels, but we are still currently holding above the 38 line but yet another spinning top proving doubt and uncertainty of the direction to come.
Until we see some harsher moves we will most likely trickle down to test the 618 before really making a decision on the short term direction, for me im still pretty bearish in the mid term and believe we havent tested new all time lows for the year just yet (keen on 2800-3000)
What is interesting though this is our forth bearish column on the volume indicator, we done often see that many bearish volume columns in a row so if we touch down on the 618 we may see some bullish volume take control temporarily with a spike to maybe test that current high around 3700, but with out descent volume it may be rejected pushing us back lower.
4hr showing a classic descending wedge, which is typically a bullish break out pattern, if the moves there it will run to that previous high, a break down says we are going low.
Always pay attention to the short and long charts on bitfinex for a basic idea of market sentiment, right now shorts are low and longs are high...can some times get a squeeze when there are lots of orders in the book specially with not a lot of short traders, could get a long squeeze with a harsh wick down to stop out long traders.....
Some times its not about predicting whats going to happen to base your trades on, some times its more about having an idea of 2 possible scenarios, having a plan in place for both and waiting for the market to react for you to put your plan into action.
Up or Down there are opportunities
ZRX/BTC long termI am keen on ZRX and have had some solid trades out of this for a while but overall pretty bearish as i see this walking down further to a level of demand build on the original run up thats been tested one before we a great response.
Using some repeating fractal patterns and some fib levels that keep getting hit with each fractal i can see us walking down to that demand following by a 786 entrancement from the last level of supply.
This will take a while but there should be some solid trading opportunities with in that range on the way up imo.
Will be keeping an eye on ZRX for those trade opportunities to present them self

EOS/BTC 14th of febEOS with a solid rejection off the current supply zone created from December drop.
Zooming in on smaller time frames we had a double top with slight divergence and the following rally failed to make a higher high.
Daily candles printed another bearish body confirming the rejection from supply.
I can see over the following weeks a retrace the the 50% of the current up trend since the start of the year being a descent area of interest for a strong support level at that demand created early Feb.
If that demand fails we are heading back down to lower demand near the last bottom which is a strong demand zone but tread cautious placing lucky dips down there.
On the upside if we do break this level of supply a push to the next minor resistance is around .0009943 with plenty of small bumps in the road on a higher target for the overall supply zone which is some 100% up the ladder.
My play for now is bearish, shorts loaded off supply but will keep a close eye on it until it starts to get some distance from that resistance then let it roll with that 50% retrace in mind.
www.unitytradinggroup.com

BTC/USD - Rejection at 4200 Level Supply- A rejection off the Supply Zone that was taken from the 2nd of December.
- Price has tested this Supply Zone 3 times since this latest rejection, thus verifying that this zone is valid.
- An easy prediction down to the Demand Zone that was formed by the red candle on the 20th of December.
- Possible outcomes would be, either a push off this Demand Zone, to one of the outlined Fib levels. Or, a fall through this Demand, to the next short target. (The next Demand below)
www.unitytradinggroup.com
