UNIUSD

UNI - when will this decline stop? UNI, like the entire cryptocurrency market, has adjusted a lot. The price was down as low as $13 at one point. It is worth highlighting that there is a lot of volume at the bottom and this is at least a good signal for local growth. In any case, the market has cleared a lot of futures positions and the situation in terms of fundamental and technical picture is starting to come back to normal.
A false break of the $13 level or a breakout of the local trend line could be a good buying opportunity.
Write in the comments all your questions and instruments analysis of which you want to see.
Friends, push the like button, write a comment, and share with your mates - that would be the best THANK YOU.
P.S. I personally will open entry if the price will show it according to my strategy.
Always make your analysis before a trade.

UNIUSD Trend and Wave AnalysisIt is in wave c and is moving towards the set price target
The wave you see in the future price on the chart is a schematic of a possible price trend and will not be formed just to clarify the possible price movement.
This is a personal analysis and should not be considered a criterion for buying or selling. Please pay attention the take profit and stop loss. Cryptos show emotional and unforeseen price behavior.
I use Elliott and Price Action in my analysis, and my analysis is based on that. The structure of the Elliott wave count is complex and different patterns are formed in the chart, so there is a possibility of a change in the price movement of the price.

LONGHi guys, Uni Swap has made a reverse head and shoulder pattern and has succeeded in breaking the neck. Goals are specified in the chart

UNIUSDT , Can we reach to 3rd target ??Hello everybody
According to our last analysis that we publish , we shown that buy zone area and exactly the price jumped from there zone and exactly both of the target will touched and reached and now do you think the 3rd target can be reach or not ??
The answer of the question its in our private channel If you want to register send us messages
Previous analysis :
Good Luck
Abtin

UNI goes for $28Uniswap is probably preparing to use the Polygon blockchain and it will be huge.
Uni has recently broken its downtrend. But now isn't a good time to buy (Risky)
There is a possibility of Pool-Back to the green zone and that's a good opportunity to enter.
Dear Friends, Always consider that not losing is better than not gaining. There will also always be good opportunities, so never get involved with FOMO.
Good Time

Uniswap (UNI) - November 30Hello?
Welcome, traders.
By "following", you can always get new information quickly.
Please also click "Like".
Have a nice day.
-------------------------------------
(UNIUSD 1W Chart) - Medium to Long-Term Perspective
Above the 8.7501025 point: the uptrend expected to continue
Since the wave is not complete, a drop from the uptrend line (1) could result in a sharp decline, so trade cautiously.
There is a possibility that we will continue to walk sideways to exceed the volume profile section of the 24.0724676-36.6077003 section, which is the high point section, so we need to think about countermeasures.
Therefore, it is important to keep the price above the uptrend line (1).
(1D chart)
The price should remain above the 20.8660947 point to continue the uptrend.
However, it is expected that there will be restrictions on the ascent due to the volume profile section formed over the section 24.0724676-36.6077003.
If the price declines from the 17.5714945 point, there is a possibility that it will fall near the 8.7501025 point, so trade cautiously.
------------------------------------------
(UNIBTC 1W Chart) - Mid- to long-term perspective
Above 0.0003540-0.0004158 section: Expected to create a new wave.
------------------------------------------
We recommend that you trade with your average unit price.
This is because, if the price is below your average unit price, whether the price trend is in an uptrend or in a downtrend, there is a high possibility that you will not be able to get a big profit due to the psychological burden.
The center of all trading starts with the average unit price at which you start trading.
If you ignore this, you may be trading in the wrong direction.
Therefore, it is important to find a way to lower the average unit price and adjust the proportion of the investment, ultimately allowing the funds corresponding to the profits to regenerate themselves.
------------------------------------------------------------ -----------------------------------------------------
** All indicators are lagging indicators.
Therefore, it is important to be aware that the indicator moves accordingly with the movement of price and volume.
However, for the sake of convenience, we are talking in reverse for the interpretation of the indicator.
** The MRHAB-O and MRHAB-B indicators used in the chart are indicators of our channel that have not yet been released.
(Because it is not public, you can use this chart without any restrictions by sharing this chart and copying and pasting the indicators.)
** The wRSI_SR indicator is an indicator created by adding settings and options to the existing Stochastic RSI indicator.
Therefore, the interpretation is the same as the traditional Stochastic RSI indicator. (K, D line -> R, S line)
** The OBV indicator was re-created by applying the formula to the DepthHouse Trading indicator, an indicator disclosed by oh92. (Thanks for this.)
** Support or resistance is based on the closing price of the 1D chart.
** All descriptions are for reference only and do not guarantee a profit or loss in investment.
(Short-term Stop Loss can be said to be a point where profit and loss can be preserved or additional entry can be made through split trading. It is a short-term investment perspective.)
---------------------------------

UNIUSDT , Did you bought ??Did you bought UNI in there zone we shown on chart ????
Did you take our last advise about UNI ????
We publish in publish in here
Previous analysis :
The price exactly come to touch our buy zone and is ready to go up , but the important thing is the trend in downward going and because of the breakwave and need correction these target is in the price way , but if the key point break the trend is changing to upward and the more target will be update if this happen
Good Luck
Abtin

CAKEUSD and UNIUSD - Too Similar to IgnoreAs you can see, there are a lot of similarities between these two pairs
Especially evident on the Gaussian Channel indicator, with both hitting the middle band
I expect this point (middle band) to be a point of bullish rejection for price, which both will follow

UNIUSDT . We are going to buy zone areaHello everybody
According to our chart and last analysis of UNI , we hope that everyone took that profit from the market of UNI
In here in this time because of the condition of the market , the price is falling down toward the most important level of support , but dont worry and be calm this is the last wave of drop before 95K and this is needed because for the health of the market
You can buy in part by part in buy zone area and hodl and be patient and enjoy your profit
UNI it can pump amazing in alt season because of the condition and because of the working and ...
Good Luck
Abtin

4h UNIUSD: Likely will head to low 30'sAs above.
Broke out of down channel and touched bottom of larger support trend line.
Appears to be headed up towards top of larger top trend line in low 30's.
The Madrid ribbon also has crossed green on the 1D and that signals bullish uptrend at least in the short term.
Will follow.
Good luck traders!

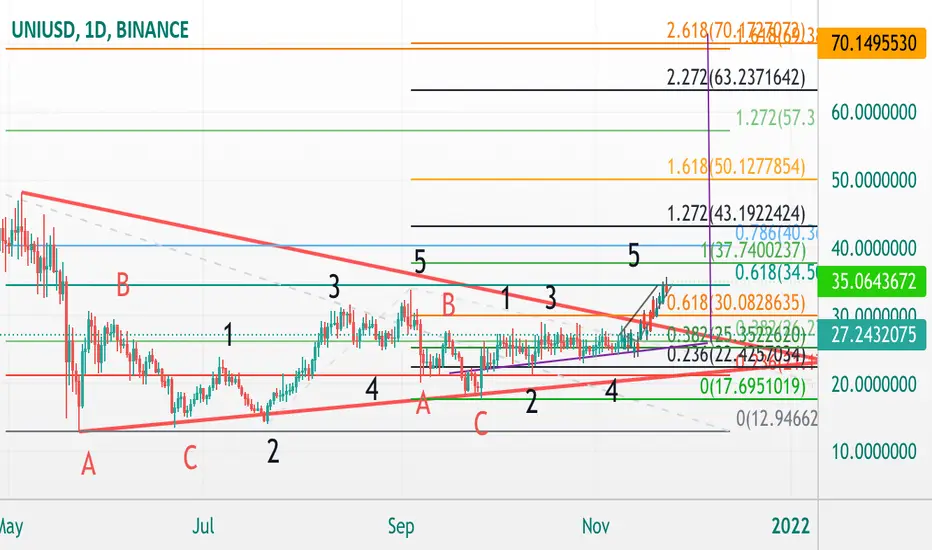
Uni Swing ~Daily algorithmic buy indication for Uni using our proprietary system,
i think it's setting up for a wave 3
wave 3 target = $41
take some profit at the given fib levels just to be safe.
in my world, see profit = take profit.
i'm not chasing the entire move, just trying to catch some of it.
✌

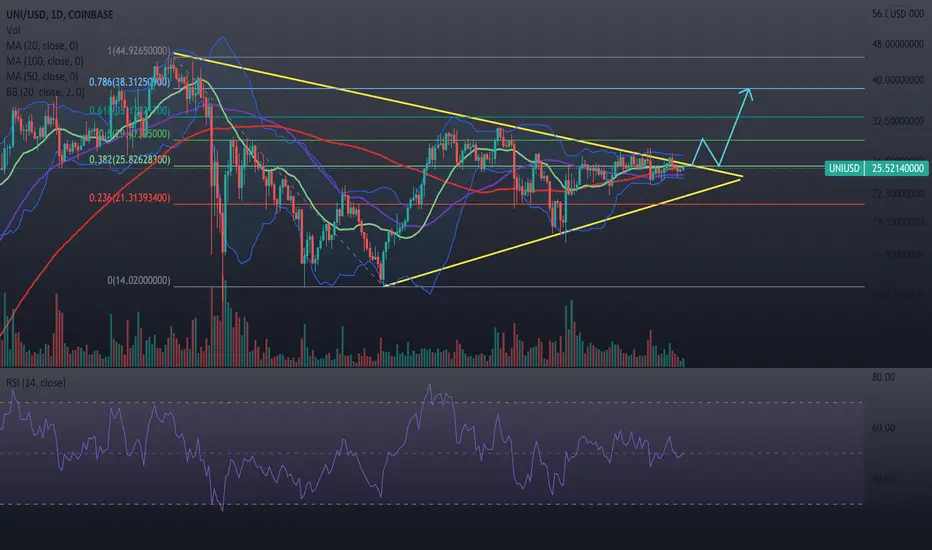
UNIUSDT LONG (in ascending triangle)Uniswap in ascending
triangle pattern
According to the RSI , I think the price will go down to 18 dollar and fly to upper 70$~130~ in short time
By observing stop loss 14 dollar
Finaly target point is 130 dollar
Ent Point : market price or best price is 18$ (if touch this price)
stop loss : 14$
TP1 : 70$
TP2: 130$
comment your opinion for this idea
Good Luck

#UNI Uniswap 1D - Big Move ComingHello friends, today I am reviewing the 1D chart for Uniswap (UNI) on a linear scale.
In the chart I noted:
1) The price has been in a long term triangle with a breakdown since May 2021.
2) Currently, the price hit the bottom of the long term trendline since January 2021 and bounced off of it.
3) The price has the potential to move up about 20% to around $25.41.
3) The RSI came out of the oversold region and has potential to bounce towards the top trendline.
4) The Ichimoku Cloud is above the price and at the top of the cloud is where the resistance is.
5) The Volume is currently very low. If volume comes in, we may be able to break out of this long term triangle.
What are your opinions on this?
If you enjoy my ideas, feel free to like it and drop in a comment. I love reading your comments below.
Disclosure: This is just my opinion and not any type of financial advice. I enjoy charting and discussing technical analysis. Don't trade based on my advice. Do your own research! #cryptopickk

Conservative Estimate of Uni Price 2023UNI has been following this uptrend on the day chart for some time now. It appears that if it continues increasing in value at this rate we could see - on the low end - UNI at $43 by Jan 2023.

$Uni time to wake upHello cryptofolks
Uniswap roadmap in chart
I expect 2 targets for now
$35 and $70
-Goodluck
Uniswap is getting ready to have a massive breakout.All of the symptoms are there. The Bollinger bands are narrowly contracted on the daily. The RSI is consolidating around the 50% level. Volume is trending lower as we get closer to the apex of the symmetrical triangle. We're in a strong bull run for BTC. What else can you ask for folks. Trades don't get easier than this.
UNI/USDTesting/tracking elliot wave theory. Please do not trade off idea without S/L. Not financial advice.

UNIUSDT Long (H4-D1)FA: DeFi + DEX narrative
TA:
1/ EMA cross (21/55/200) on H4
2/ Higher lows
3/ Decent volume on 26 sept (wide-spread green candle)
4/ diag resistance break-up
Entry: 25-26
Stop: 17.5
TP1 - 41.7 (25% fix, R/R - 2:1)
TP2 - 130-140 (50% fix, R/R - 13:1)

UNIUSDT , We are going toward buy zone area Hello everybody
In here we have amazing chart that we analysied last week and exactly the market is moved to our way and reached to our target .
At this time we need more pullback to buy some UNI , exactly you can buy in buy zone area with signal ( like hammer or ascending cover or price pattern ) then you can buy and dont forget use stop loss and target
UNI is one the most powerful project in Defi , One the most coin that we should have in our portfolio
Previous analysis :
Be with us and sleep comfortably
If you have question ask us
Good Luck
Abtin

UNIUSD and ETHUSDAn idea comparing two points. One that is in progress (UNI) and one that has already occurred (ETH)
The coins begun there lives with a V shaped structure that can be seen across the two (white rectangle)
The pattern though I believe is continuing further.
UNI gains would be massive if this is considered a viable comparison

UNISWAP Time to BUY!Hey traders,
Everything is marked on chart!
Do not forget to use Stop loss.
Please like and share.
Thank you.

Is UNI Breaking out ? It seems like that we are going to close above the trend line wich can indicate an upper move. Let's keep an eye on it.
