DOT: Something like thisCould play out this way - DOT is currently in a descending wedge which is a reversal pattern and on the 1H timeframe is inside an Inverse H&S - which combined with the descending wedge means we should rise back to the previous local highs if everything plays out accordingly.
TP1 $53
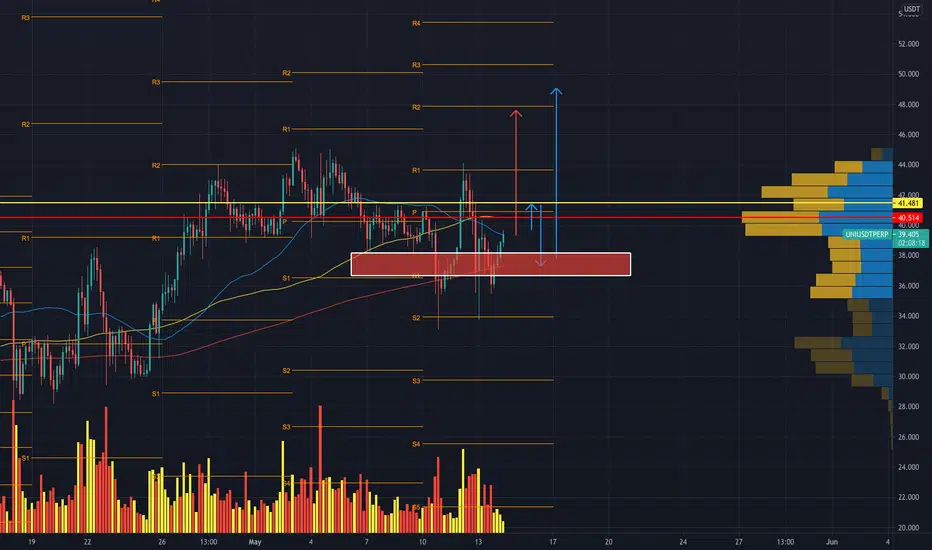
UNIUSD

Uniswap (UNI) - May 21Hello?
Dear traders, nice to meet you.
By "following" you can always get new information quickly.
Please also click "Like".
Have a good day.
-------------------------------------
(UNIUSD 1D chart)
You should watch for any movement that deviates from the 22.11036180-28.836657176 section.
In order to turn to an uptrend, it must rise above the 35.56278172 point and gain support.
However, it remains to be seen if it can rise above the 28.83657176 point and move sideways.
-------------------------------------
(UNIBTC 1D chart)
We have to see if we can get support and ascend in the 61028 Satoshi-63445 Satoshi section.
If it falls at 61028 Satoshi branch, you can touch 48994 Satoshi branch or lower, so you need Stop Loss to preserve profit and loss.
However, you can hit the 53565 point and go up, so you need to trade carefully.
--------------------------------------
It is advisable to trade at your average unit price.
This is because if the price flows below your average unit price, which was on an uptrend or downtrend, there is a high possibility that you will not be able to earn a large profit due to the psychological burden.
The center of every trade starts with the average unit price you start trading.
If you ignore this, you may be trading in the wrong direction.
Therefore, it is important to find a way to lower the average unit price and adjust the proportion of the investment, so that the money that ultimately corresponds to the profit can regenerate the profit.
-------------------------------------------------- -------------------------------------------
** All indicators are lagging indicators.
So, it's important to be aware that the indicator moves accordingly with the movement of price and volume.
Just for the sake of convenience, we are talking upside down for interpretation of the indicators.
** The wRSI_SR indicator is an indicator created by adding settings and options from the existing Stochastic RSI indicator.
Therefore, the interpretation is the same as the conventional stochastic RSI indicator. (K, D line -> R, S line)
** The OBV indicator was re-created by applying a formula to the DepthHouse Trading indicator, an indicator that oh92 disclosed. (Thank you for this.)
** Check support, resistance, and abbreviation points.
** Support or resistance is based on the closing price of the 1D chart.
** All explanations are for reference only and do not guarantee profit or loss on investment.
Explanation of abbreviations displayed on the chart
R: A point or section of resistance that requires a response to preserve profits
S-L: Stop Loss point or section
S: A point or segment that can be bought for profit generation as a support point or segment
(Short-term Stop Loss can be said to be a point where profits and losses can be preserved or additionally entered through installment transactions. It is a short-term investment perspective.)
GAP refers to the difference in prices that occurred when the stock market, CME, and BAKKT exchanges were closed because they do not trade 24 hours a day.
G1: Closing price when closed
G2: Cigar at the time of opening
(Example) Gap (G1-G2)

Uni 1D Where globally can fallFor more than 4 months we have not made a global idea according to the UNIUSDT schedule
It's time to correct this not justice)
For 3.5 months, the UNIUSD price was moving in channel upward from border to border. And tonight they broke this channel down, of course, that the negative on the cryptomarket helped this.
On the positive side, the UNI price drop occurs without abnormally large volumes.
If this trend continues without volume, then the UNIUSDT price should not fall below $22 . From this level it would be good to see an increase in trading volumes and buyback of a fall, the chart should turn into consolidation with a continuation of the rebound at least to $32.5-36
If the negative on the cryptocurrency market continues , and the trend itself finally turns into a long-term correction, then from below the price of the Uniswap project token will be met by two zones: $13-14 and $9-10
_______________________________
Since 2016 , we have been analyzing and trading the cryptocurrency market.
We transform our knowledge, trading moods and experience into ideas. Each "like under the idea" boosts the level of our happiness by 0.05%. If we help you to be calmer and richer - help us to be happier :)


UNI: A Summer Trade Set-Up (Update)From my previous post targets to buy have hit... watching this closely at the moment. Not Financial Advice...CHEERS!

UNI - $82.99UNI is currently trading close to the resistance zone at $36.40. It has a good support at $31.69. If UNI can break the resistance at $36.40 and flip it to support, we could start seeing a move towards $39.25, $41.56 and $44.44. The resistance at $44.44 is an important one. If UNI can break this resistance and flip it to support, we could start seeing a much higher move towards $47.16, $51.34, $63.43 and $82.99. Long at support of $31.69 or breakout of resistance of $36.40.
Stop loss should be kept below $31.69. If this support breaks, it could lead to a drop towards $27.76 and $24.85.


UNIUSDT LONG📈✅Everything clear in the chart with all possible SUPPORTs and RESISTANCEs, and clear direction as we are in Bottom of strong bull channel
Whoever missed this, it is time to jump in beautiful ascending trend within nice channel
There are different scenarios to enter this setup which clearly you can decide why with which scenario to open BUY position in what areas ... completely depends to your strategy and type of trading style!
Make sure you is we break channel to down we have to more conservative in BUY position ofc with nice stop and nice R:R
Lets see how this beauty moves ...
Any question here to answer @FxShzd
Good luck ✅👌🏻📈

UNIUSDT UPDATE!!!!1Hi Traders,
UNI is looking good for a LONG very soon. Price could either break straight up or we could see a test at the pivot for a fall in price within the zone to then break up and create a new high!
As always if you enjoy the content don't forget to click the like button and make a comment on your opinion.
Thanks
MS
⬇️⬇️⬇️⬇️⬇️⬇️⬇️⬇️⬇️⬇️⬇️⬇️⬇️⬇️⬇️⬇️⬇️⬇️⬇️⬇️⬇️⬇️⬇️⬇️⬇️⬇️⬇️⬇️⬇️⬇️⬇️⬇️⬇️⬇️⬇️⬇️⬇️⬇️⬇️⬇️⬇️⬇️⬇️⬇️⬇️⬇️⬇️⬇️⬇️⬇️⬇️⬇️⬇️⬇️⬇️⬇️⬇️⬇️⬇️⬇️⬇️⬇️⬇️⬇️⬇️⬇️⬇️⬇️⬇️


Uniswap: Potential HarmonicUniswap seems to be forming a little harmonic on the daily... I will be watching this coin very closely. Not Financial Advice...CHEERS!

UNI Bullflag or Rising Wedge? UNI has formed a wedge
Whether or not this will act as a Rising Wedge (bearish scenario) is unlikely considering the bullish momentum behind it, and a possible flagpole confirming the bullflag theory
It is more likely that this will lead to bullish continuation rather than a break down is what I'm trying to get across

New Price Target for UNI -> $48UNI broke the ascending triangle to find support at $40 multiple times! enter channel approx. $44 and exit $48. Good luck! Don't miss this one, many others altcoins will be tanking soon as they've been too hyped-up and retail traders will get anxious and start selling before the make a big loss....I was there the last crash!

Uniswap is ready to riseChannel breakout + bull flag. As long as bitcoin remains >54k it will explode imho

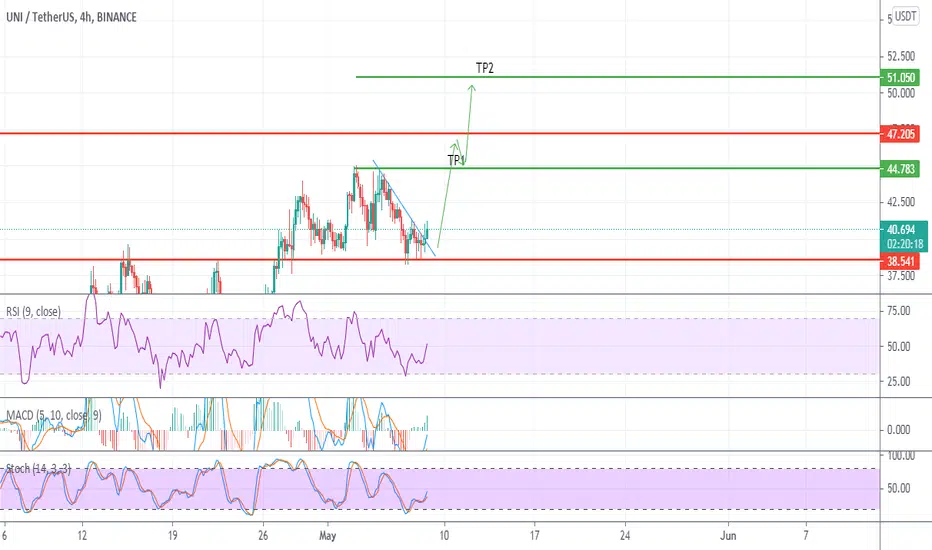
ichimoku trade : long positionresistance from cloud.break last 26 days top.buy position at 40.85$ today and tomorrow.
stop loss: kijunsen(with buffer)


UNI Breaks the Resistance? In case of breaking the Resistance , Actually the midline has Broken! So, It is Free to continue Up Warding, Let's See..
Note : Be Aware Strongly before any purchase order.

Uniswap (UNI) - May 2Hello?
Dear traders, nice to meet you.
By "following" you can always get new information quickly.
Please also click "Like".
Have a good day.
-------------------------------------
(UNIUSD 1W chart)
(1D chart)
You should watch for any movement that deviates from the 37.80485161-46.77313174 section.
In particular, it remains to be seen if it can rise above the 42.28899168 point.
If you fall in the 35.56278172-37.80485161 section, you will need a short stop loss.
However, it may rise along the uptrend line, so careful trading is necessary.
The next volatility period is around May 9.
-------------------------------------
(UNIBTC 1W chart)
(1D chart)
61028 Satoshi-73062 Satoshi We must watch for any movement that deviates from the section.
We have to see if it can rise within the rising channel.
44983 Satoshi-48994 If you fall in the Satoshi section, you need Stop Loss to preserve profit and loss.
--------------------------------------
It is advisable to trade at your average unit price.
This is because if the price flows below your average unit price, which was on an uptrend or downtrend, there is a high possibility that you will not be able to earn a large profit due to the psychological burden.
The center of every trade starts with the average unit price you start trading.
If you ignore this, you may be trading in the wrong direction.
Therefore, it is important to find a way to lower the average unit price and adjust the proportion of the investment, so that the money that ultimately corresponds to the profit can regenerate the profit.
-------------------------------------------------- -------------------------------------------
** All indicators are lagging indicators.
So, it's important to be aware that the indicator moves accordingly with the movement of price and volume.
Just for the sake of convenience, we are talking upside down for interpretation of the indicators.
** The wRSI_SR indicator is an indicator created by adding settings and options from the existing Stochastic RSI indicator.
Therefore, the interpretation is the same as the conventional stochastic RSI indicator. (K, D line -> R, S line)
** The OBV indicator was re-created by applying a formula to the DepthHouse Trading indicator, an indicator that oh92 disclosed. (Thank you for this.)
** Check support, resistance, and abbreviation points.
** Support or resistance is based on the closing price of the 1D chart.
** All explanations are for reference only and do not guarantee profit or loss on investment.
Explanation of abbreviations displayed on the chart
R: A point or section of resistance that requires a response to preserve profits
S-L: Stop Loss point or section
S: A point or segment that can be bought for profit generation as a support point or segment
(Short-term Stop Loss can be said to be a point where profits and losses can be preserved or additionally entered through installment transactions. It is a short-term investment perspective.)
GAP refers to the difference in prices that occurred when the stock market, CME, and BAKKT exchanges were closed because they do not trade 24 hours a day.
G1: Closing price when closed
G2: Cigar at the time of opening
(Example) Gap (G1-G2)

UNI Bullish-trend expectation in mid or long termAs you can see we can expect the UNI can go to 78 dollars in mid or long time frame.

UNI: A Summer Trade Set-UpIncase UNI wants to visit the $33 level again I would be looking for these levels throughout the summer... Defi seems to becoming more legit. Not Financial Advice... CHEERS!
