UNIBTC - What is the direction of next 20% move?UNI faced with descending channel reasistance and currently is in a sideway mode..
The next move depends on BTC
UNIUSD

Looking like another failed reversal - are we going back down?The current situation:
1. Price action previously had gotten back on top of the hourly 21 and 50MA, which looked like it could've been a start to a reversal, especially with bullish double divergence apparent on the 6HR chart. Since then, it had been rejected at the 3 USD level and now has formed a head and shoulders pattern on the 15M chart, which is bearish. The measured target of the pattern is about 2.6 USD from the neckline at about 2.8 USD
The bullish case: price action gets support by the hourly 21 and 50MA, which is currently near the neckline of the head and shoulders pattern and retries the $3 level.
The bearish case: price action breaks below the neckline towards the measured target.
*Thank you to those who donated, I very much appreciate it.
*Let me know in the comment section if you agree or disagree, would love to hear your ideas too.
*These are purely my speculations and not financial advice. You should always do your own due diligence before trading or investing.

THE GREAT CHANCE TO BUY YFI WITH COFFEE TIME!Expecting that this are the best moment to buy YFI for long term effect.
---> YFI BREAKOUT coming.
All our before coffee time for YFI hit.
YFI increase trend on made
# not an advice.

UniSwap UNIUSDT - Elliot Wave + Channel.My Elliott Wave count is completed. There should be at least a bigger bounce to the upside. The descending parallel channel respects the blue lines also very nicely. I have to say one thing - the trend is so extended and it has to come to the end.
Please, hit the like button and follow me for more of these ideas!
Also, check my signature down below ↓

UNIUSD: 4H watch for bounce...very oversold As above.
Looks like ready for turn around....
Good luck traders!

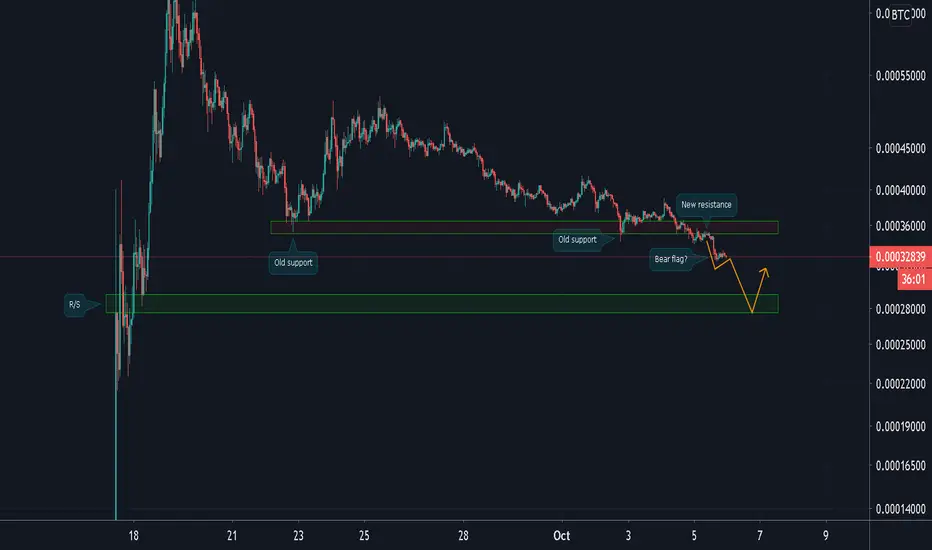
UNI/BTC (Bearish Key Support Break?)💎Technical Analysis Summary💎
BINANCE: UNIBTC
-UNI broke key support area and retested as a new resistance zone
-This is looking Bearish in the midterm in terms of price action
-If this small Bear flag confirms the downward direction
-The next key area of support is located at 29000-27000 sat
A big Thanks for donating 💰 via Tradingview coins this week to seba26-77 🙏🎉
``````````````````````````````````````````````
Trading Involves High Risk ⚠️
Not Financial Advice 💸
Please Exercise Risk Management 💱
``````````````````````````````````````````````
If You Like My Daily Published Ideas 👍
A little Help By Supporting My Channel 📺
Through Leaving A Thumbs Up, Comment & Follow 💬
Happy Trading! ➡️ Thank You! 😊
``````````````````````````````````````````````
UniSwap UNIUSDT - Elliott Wave + Parallel ChannelI reworked my Elliott Wave count and i still miss one last wave to the downside. This count is also a valid EW as the previous one. The descending parallel channel respects the blue lines also very nicely. I have to say one thing - the trend is so extended and it has to come to the end. There is another good buy opportunity on the bottom of the channel. See my related UniSwap idea down below ↓, also a valid Elliott Wave count.
If you like this technical analysis, please hit the like button and follow me for more of these ideas!
Also, check my signature down below ↓

UNISWAP - Time to buy again?It seems like the downmove is close to its end, which makes me feel bullish regarding the UNI token, again... I see similar situation as before, at the last bigger up-move. On h4 the MACD is trying to turn back to the green zone again, slowly, while on h1 the price is about to draw a clean and strong continuous divergence. If it all happens, that will confirm a buy signal at around $4.000 or somewhere in the $3.9 - $4.2 zone. What do you think?


UniSwap Price Forecast: UNI Awaits Ultimate Liftoff To $5
UniSwap looks forward to a descending wedge pattern breakout to $5.00.
UNI/USD is holding above the 21 SMA while the upside is capped under the 50 SMA.
UniSwap has been on a downward roll since September after its bullish scenario was cut short by resistance at $5.60. The price has continued to narrow within the confines of a descending wedge pattern. This pattern forms whenever the value of an asset has been falling over a period of time. Breakouts can either be up or down, however, falling wedge patterns tend to signal an incoming bullish breakout. Note that to properly trade this pattern, the trader must employ other technical indicators.
At the time of writing, UNI is trading at $4.28 after suffering another rejection at the descending trendline as well as the 50 Simple Moving Average (SMA) in the hourly range. The price is immediately supported by the 21 SMA.
Looking at the Relative Strength Index (RSI), UniSwap is likely to continue exploring the levels towards $4.00. It is essential that support in the range between $4.2 and $4.3 is defended at all costs. According to IntoTheBlock, this is the strongest support zone. Here, 9,600 addresses bought 20.4 million UNI. If this level zone is shattered, UNI will extend the bearish leg to $3.50.
On the other hand, a bounce from the support will have the potential to push the price out of the wedge. A breakout from the wedge will place UNI on the path to $5.00. Closing above the 50 SMA is particularly vital to the bullish case because it will add credence to the breakout. Traders must keep in mind potential resistance zones at $4.60 and $4.80, respectively.
UniSwap Intraday Levels
Spot rate: $4.30
Percentage change: -1.82%
Relative change: -0.08
Trend: Short term bearish bias
Volatility: Low


Hidden bullish divergence?I think this is what they call a hidden bullish divergence. I believe this indicates continuation of the uptrend. I am still new to trading so if this is not right, please correct me in the comments!

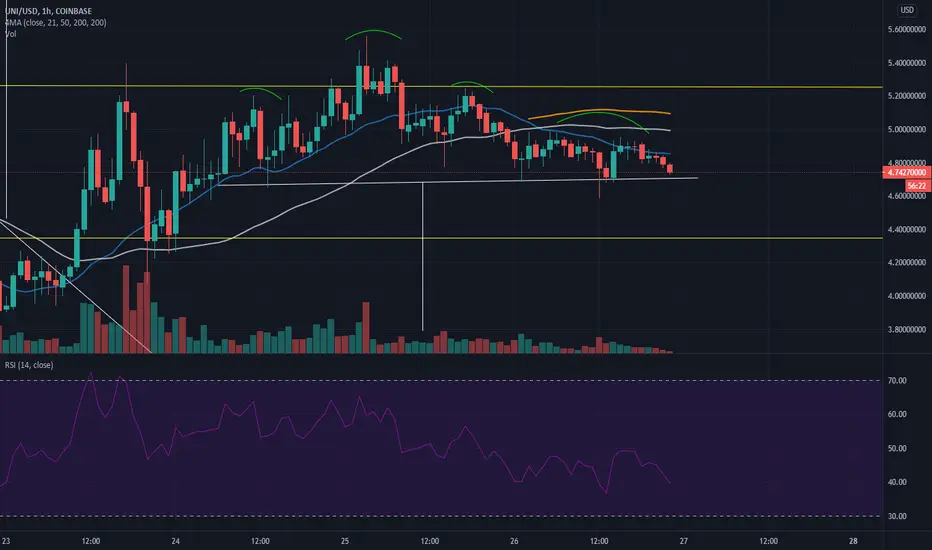
Failed breakout - watch out if THIS level of support breaks The current situation:
1. The price action previously failed to break out of the ascending triangle that was in (see my previous posts) and now it looks bearish as a head and shoulders pattern is more apparent on the 1HR chart. The price action has also broken below the 4HR 21MA and now the moving average that is acting as support is the 6HR 21MA. This is also at about the neckline of the head and shoulders pattern, with a measured target of about 3.8 USD
The bullish case:
1. The price action bounces off the 6HR and retry the resistance at about 5.25 USD
The bearish case:
1. Price action breaks below the 6HR 21MA, under which the next level of support is the 0.786 FIB level at about 4.35 USD
*Let me know in the comment section if you agree or disagree, would love to hear your ideas too.
*These are purely my speculations and not financial advice. You should always do your own due diligence before trading or investing.
Uniswap / Usd - Time to go long?It could be the bottom of the down move (at least in near short term). Waiting for the patterns / break outs, while the candle right here on the support line seems like a good entry sign to buy with great RR ratio, including tight SL. What do you think? I see similar head & shoulders pattern on Dollar index...

Uniswap / Usd - Time to re-entry??I'm about to re-entry for a second bullish wave at this moment. Will it goes up, or the bears gonna win this fight? Nobody knows, but I see potential in this price level - as a possible false break down -, and I can take action here with tight SL again. What do you think? Is there anybody who thinks the same?


UNI/USDTWaiting for the current local resistance to turn into support.
Might catch a long below 4.7500


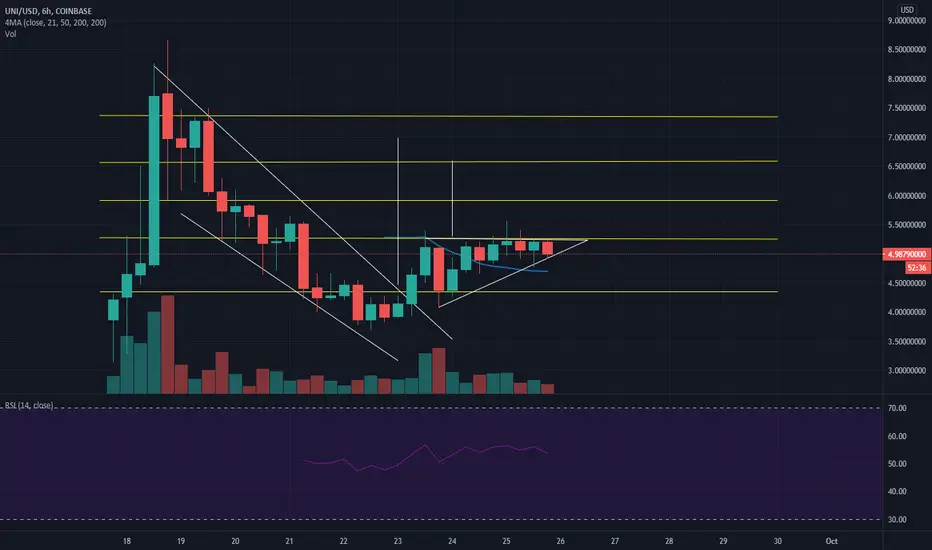
Failed breakout but another retry looks to be on the wayThe current situation:
1. Yesterday, 9/24, price action attempted to break out of the ascending triangle as shown but had failed and got rejected at about 5.55 USD. Now it has retreated back to the 1HR 50MA at about 5 USD as support and the bottom trend line is now adjusted for a bigger ascending triangle. If price action breaches the 1HR 50MA, the next level of support is the 4HR 21MA followed by the 6HR 21MA.
A complex head and shoulders pattern also apparent on the 1HR chart, so this should be paid attention to in case the bulls do not hold up the price.
Looking at the price action from the 6HR chart, this is still appears to be a bullish setup as price action broke the 21MA and now is retesting it as support. The resistance to break is still the FIB level at about 5.25
*Let me know in the comment section if you agree or disagree, would love to hear your ideas too.
*These are purely my speculations and not financial advice. You should always do your own due diligence before trading or investing.

UNI/USD Resistance (Targets) & Support LevelsHere we have the UNIUSD support and resistance levels.
This is done by request.
The dotted gray and orange lines on the chart can be used as targets.
Below the current price, we call them support.
Above the current price, we call them resistance.
I hope that helps.
Namaste.


