UNI.USDT (Y21.P1.E2.v2).Macro.Bullish structureHi All,
A continuation of the previous post, link below
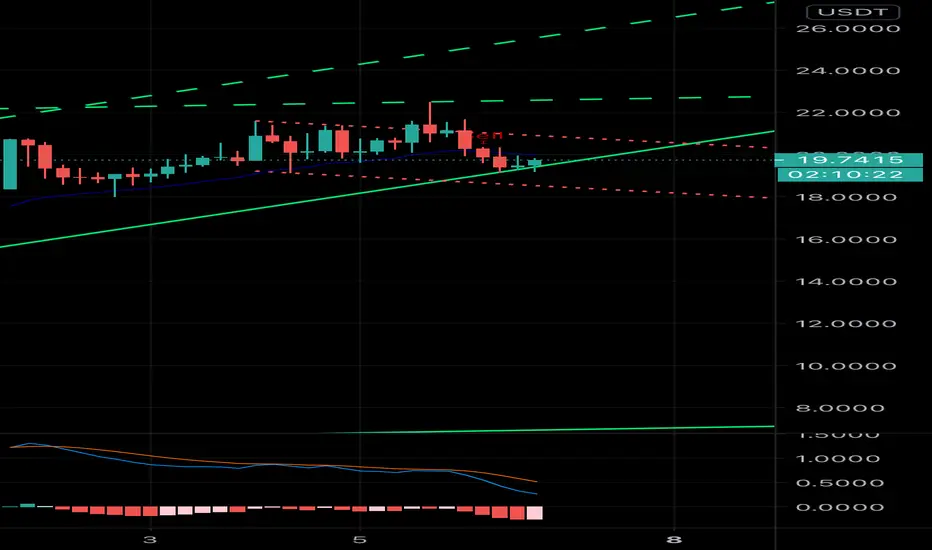
You see the pattern, yes,
Bullish candle on the 8 hrly for an entrance with the assistance of the WT indicator or one of your choice.
All the best,
S.SAri
PREVIOUS POST
Uniusdt

Uniswap (UNI) - February 8Hello?
Dear traders, nice to meet you.
"Like" is a huge force for me.
By "following" you can always get new information quickly.
Thank you for always supporting me.
-------------------------------------------------- -----
It is one of the coins that is not easy to catch the flow due to the rapid rise.
We have to see if we can get support and climb in the 17.436-18.467 range.
If you move down at 14.343, you need a short stop loss.
On the wRSI_SR indicator, when the RS line rises by more than 20 and turns into an upward flow, you need to check which section is supported.
-------------------------------------------------- -------------------------------------------
** All indicators are lagging indicators.
So, it's important to be aware that the indicator moves accordingly with the movement of price and volume.
Just for convenience, we are talking upside down for interpretation of the indicators.
** The wRSI_SR indicator is an indicator created by adding settings and options from the existing Stochastic RSI indicator.
Hence, the interpretation is the same as the conventional Stochastic RSI indicator. (K, D line -> R, S line)
** The OBV indicator was re-created by applying a formula from the DepthHouse Trading indicator, an indicator that oh92 disclosed. (Thank you for this.)
** Check support, resistance, and abbreviation points.
** Support or resistance is based on the closing price of the 1D chart.
** All explanations are for reference only and do not guarantee profit or loss on investment.
Explanation of abbreviations displayed on the chart
R: A point or section of resistance that requires a response to preserve profits
S-L: Stop Loss point or section
S: A point or segment that can be bought for profit generation as a support point or segment
(Short-term Stop Loss can be said to be a point where profits or losses can be preserved or additionally entered through installment transactions. It is a short-term investment perspective.
GAP refers to the difference in prices that occurred when the stock market, CME, and BAKKT exchanges were closed because they do not trade 24 hours a day.
G1: Closed price
G2: Market price at the time of opening
(Example) Gap (G1-G2)

UNI usdt - a decent price correction from its highsWe've seen a good drop in UNIswap prices.
Expect to see a climb back to the 4h resistance level

UNI/USDT SHORT TERM BOUNCE IDEAHey hey my friends!
Usually we don't trade on Sundays but when alerts go off....you make sacrifices
Looking to go ahead and enter a long here, looks strong rsi pretty much on oversold with stochastic being heavily oversold for sometime now, with the macd starting to curl up, the histogram running out of downward momentum, and a bounce forming on the support!
Short-term targets are on the chart
Enjoy my friends!

Short UNIUSD to 15 USDFollowing a hidden bearish divergence and a head and shoulders formation in the UNIBTC chart, the next target price could be 0.00045 BTC . This also corresponds with a previous key support.
The UNIUSD chart shows an ascending wedge which might break out to the downside at any time, with target price at 15 USD.


UNI usdt climb to $22 markStrong resistance at the $21 mark but it will continue to climb.
Support levels have risen. Slight decline of EMA. Good trading volumes.

UNI - U kno it's about to go parabolic! Hello Traders,
UNI took off for a minute there this late morning but it's taking a little pullback, which I've been layering in purchases.
A few things, inverse head, and shoulders, rising RSI & MFI.
I see quite a bit of volume as we get to the $24/$25 range.
I have my take profit right before that around $23.5.
Good luck!

UNI 4h A strong momentum nearWe wrote a lot about UNIUSDT in the previous idea , check if you are interested in this coin.
Now we want to remind you that the consolidation triangle is nearing completion and there will be a strong momentum.
The upper limit is 20.80 and the target is 23.50
The lower limit is 20.10 and the target is 18.60
_______________________
We create both short-term ideas (for a local understanding of the market situation) and medium-term forecasts of price movements.
Subscribe to us and get daily concise analytics!

UNIUSDT Forming Ascending Triangle with a Great Gain PotencyUNIUSDT is approaching Resistance 20.72 and forming ascending triangle pattern. There will be a great gain potency for UNIUSDT to reach it's uptrend line Resistance at around 24.3.
Stochastic RSI seems to be crossing on demand zone at chart 1H.

UNISWAP - The Simplest Trading Strategy in the WorldUNISWAP
The Simplest Trading Strategy in the World. be patient and let the trade comes to you
Trading Responsibly: Your Ticket to Long Term Success
Resistance 1 --- 19.14
Resistance 2 --- 20.25
Resistance 3 -- 21.39
Resistance 4 -- 22.56
Resistance 5 --- 23.77 Breakout


UNISWAP ASCENDING TRIANGLE Hi guys, UNISWAP is a token from a platform that allows you to convert crypto into many cryptocurrencies (that aren't on other exchanges).
As always a nice acending triangle could lead to an very bullish trend, (UNI is already in an super bullish trend).
For me this crypto is still very under-evaluated. The key is this (as all crypto) crypto is volume, and it actually generates a lot.
TARGET : MOON

#UNIUSDT trading plan!Hi friends!
A very strong coin!
Since the end of December, for 1 month it has given + 400%, while it practically does not roll back.
At the moment, the pair met resistance below the 20.76$ level.
And for several days it has been consolidating under it.
When the level of 20.76$ is broken, I plan to buy, a strong buyer is sitting in the coin.
✔ Do not forget to trade using your own trading system and with stops!
✔ If you like what I do, put 👍 and subscribe! 🙌👀
✔ This is the best gratitude for my work! 💕
