Update


atom sell midterm "🌟 Welcome to Golden Candle! 🌟
We're a team of 📈 passionate traders 📉 who love sharing our 🔍 technical analysis insights 🔎 with the TradingView community. 🌎
Our goal is to provide 💡 valuable perspectives 💡 on market trends and patterns, but 🚫 please note that our analyses are not intended as buy or sell recommendations. 🚫
Instead, they reflect our own 💭 personal attitudes and thoughts. 💭
Follow along and 📚 learn 📚 from our analyses! 📊💡"

Amazon losing weekly trendline – watch these Fibo levels nextTechnical Analysis
Amazon (AMZN) has broken below its weekly ascending trendline and failed to reclaim the key 0.618 Fibonacci level (180.52). Strong bearish volume and a weakening RSI suggest downside continuation. Key support targets lie at 161.55, 151.21, and 142.58, with extended downside to 119.12.
Fundamentals
Macro pressure from high interest rates and a slowdown in consumer spending weighs on Amazon. Intense competition in AWS and e-commerce adds uncertainty. Upcoming earnings may serve as a catalyst for directional clarity.
Scenarios:
Base case – move down toward 151.21, 142.58, 119.12
Bullish case – break above 180.52 → rally toward 207.52, 241.92

Strong Breakout on WUSDT: Potential for Major Bullish Move WUSDT has recently completed a strong breakout from a key resistance zone, signaling a potential shift in momentum and attracting significant attention from traders. The technical setup points to a confirmed breakout with increased trading volume, which typically precedes a powerful rally. This move is further supported by market participants showing renewed interest in the project fundamentals, positioning WUSDT for a potential bullish continuation.
With solid volume pouring in post-breakout, WUSDT looks ready to make a major move to the upside. Current market structure indicates a healthy retest of the breakout level, setting the stage for a possible rally of 250% to 300% in the coming sessions. Such gains are within reach, especially if broader market sentiment remains positive and volume continues to climb.
Investor confidence in WUSDT is growing, as many see it as an undervalued gem ready to reclaim higher levels. Its technical strength, combined with strong buying activity, presents an attractive opportunity for both swing traders and long-term holders. Watch for key psychological resistance levels to act as future targets while support holds firm below.
✅ Show your support by hitting the like button and
✅ Leaving a comment below! (What is You opinion about this Coin)
Your feedback and engagement keep me inspired to share more insightful market analysis with you!

WHY GOLD IS BULLISH??? DETAILED TECHNICAL AND FUNDAMENTALSXAUUSD is currently trading at 2940 after successfully breaking out of a **bullish pennant** pattern, signaling a continuation of the upward trend. This breakout suggests a strong bullish wave is forming, with a target of 3000 in sight. The bullish pennant is a well-known pattern that occurs after a strong price surge, followed by consolidation before the next leg higher. With the breakout already confirmed, buyers could push gold toward new highs.
From a technical perspective, the breakout above the pennant’s resistance indicates growing bullish momentum. If xauusd sustains above 2930-2940, further upside movement is likely, with 2970 as the next key resistance before reaching 3000. Volume confirmation and a retest of the breakout zone could strengthen the bullish case. Traders should watch for price action signals, such as bullish candlestick formations, to confirm the continuation of the uptrend.
On the fundamental side, gold remains well-supported due to **global economic uncertainty, central bank gold purchases, and inflation concerns**. The Federal Reserve’s monetary policy decisions will also play a crucial role in xauusd’s next move. A weaker us dollar, lower bond yields, or increased risk-off sentiment could further drive demand for gold as a safe-haven asset, fueling the rally toward 3000 and beyond.
In summary, xauusd has completed a **bullish pennant breakout**, setting the stage for a strong push toward 3000. Traders should monitor key resistance levels and volume confirmations for potential buying opportunities. If the momentum sustains, gold could continue its bullish trajectory, offering a high-probability trade setup.

"EURNZD Bullish Momentum Continues: Next Wave After Retest"EURNZD has followed the predicted bullish momentum, currently trading at 1.89 and aiming for the 1.93 target. The pair remains strong within its uptrend, signaling continued buying pressure. However, a small retesting phase is likely before the next bullish wave, allowing the market to confirm support levels and attract further buyers. This setup aligns with the technical outlook, reinforcing the expectation of further upside movement.
A minor retracement or consolidation at current levels could offer a healthy correction, giving traders an opportunity to re-enter before the next surge. Fundamental factors, including recent economic data from the Eurozone and New Zealand, suggest a favorable scenario for EUR strength. If risk sentiment remains positive and the European economy continues showing resilience, EURNZD could gain further momentum toward the 1.93 target.
Traders should watch for confirmation signals such as increased volume, bullish candlestick formations, or breakouts from key resistance zones. If the pair successfully holds above its retesting level, the next leg of the rally could unfold, offering another profitable move. As always, proper risk management is crucial to navigate potential market fluctuations effectively.

GBPUSD FUNDAMENTALS AND TECHNICAL ANALYSISGBPUSD is currently trading at 1.265, showing strong bullish momentum as it finds solid support at this level. The gradual increase in trading volume indicates growing interest from buyers, suggesting that the pair is gaining strength for a potential move toward the 1.288 target. If this support level holds, we could see further bullish continuation in the coming sessions.
From a technical perspective, GBPUSD is respecting key support, with increasing volume confirming buyer interest. A break above minor resistance levels could further accelerate the uptrend, providing a clear path toward 1.288. If price action remains above 1.260, it will reinforce the bullish outlook, while traders should watch for any pullbacks as potential buying opportunities.
Fundamentally, GBPUSD's strength is influenced by a softer US dollar as expectations around the Federal Reserve’s rate policy shift. Any dovish signals from the Fed or weaker US economic data could push the dollar lower, giving GBP an advantage. Additionally, positive UK economic indicators or a hawkish stance from the Bank of England could further support the pair’s bullish momentum.
In summary, GBPUSD is holding strong support with increasing volume, signaling potential upside toward 1.288. If this bullish momentum sustains, traders could capitalize on the breakout, with confirmation needed through technical signals and macroeconomic developments. Keep an eye on resistance levels and market sentiment for further validation.

EURJPY Bullish Breakout: Targeting 300 Pips Toward 161.500EURJPY is currently trading at 157.500, having completed a falling wedge breakout and now holding above a key support level. The falling wedge is a strong bullish reversal pattern, indicating that after a period of consolidation, buyers are stepping in to drive the price higher. If this support holds, EURJPY could gain further momentum, targeting the 161.500 level for a potential 300-pip move.
From a technical perspective, the breakout has already been confirmed, and price action suggests that bulls are in control. A strong hold above support, along with increased buying pressure, could push EURJPY toward its next resistance zone near 161.500. Traders should watch for bullish candlestick formations and volume confirmation to strengthen the breakout scenario.
On the fundamental side, the euro’s strength against the yen is largely driven by monetary policy divergence between the European Central Bank (ECB) and the Bank of Japan (BoJ). The ECB remains relatively hawkish, while the BoJ continues its ultra-loose monetary policy, keeping the yen weak. Additionally, risk-on sentiment in global markets tends to favor EURJPY upside.
In summary, EURJPY has broken out of a falling wedge and is holding above a critical support level, with bullish momentum building. If this level remains intact, the pair could see a 300-pip rally toward 161.500. Traders should monitor price action, volume, and any shifts in ECB or BoJ policy for further confirmation of the bullish trend.

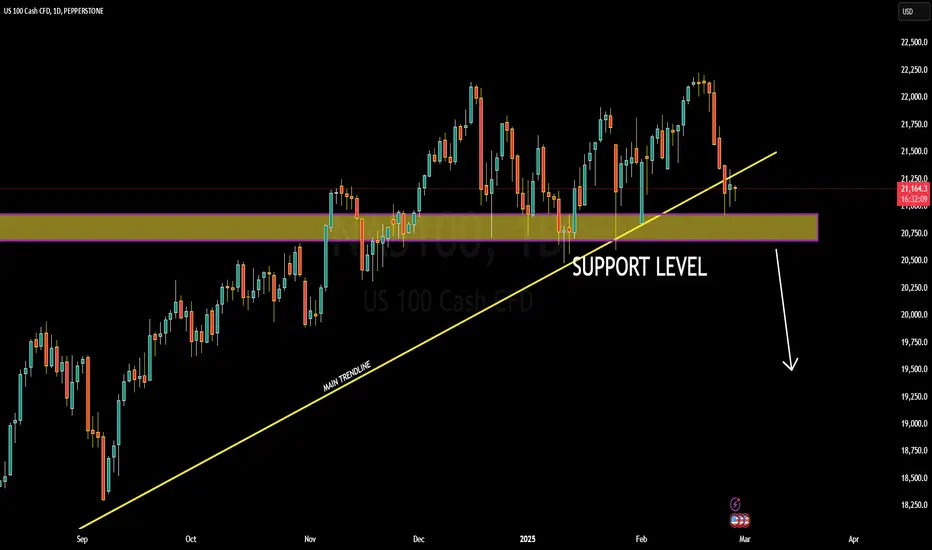
NAS100 at Critical SupportNAS100 is currently trading at 21,150, having completed a falling wedge breakout and now holding at a key support level. The falling wedge is typically a bullish pattern, but in this case, price action suggests a crucial test of support. If this level fails to hold, NAS100 could see significant downside momentum, potentially targeting the 19,000 level.
Technically, a breakdown below this support could confirm a bearish continuation, triggering a strong sell-off. Traders should watch for increased selling pressure and a sustained move below the support zone, which could accelerate bearish momentum. If the support holds, however, NAS100 could attempt a recovery, making this a decisive level to monitor.
Fundamentally, NAS100 remains under pressure due to concerns over Federal Reserve policy, interest rate expectations, and broader market sentiment. Any signs of prolonged high rates or weak earnings from major tech companies could fuel further downside pressure. Additionally, rising bond yields and a stronger US dollar may continue to weigh on the index.
In summary, NAS100 is at a critical support level after a falling wedge breakout, with the potential for a sharp drop if the support breaks. Traders should closely monitor price action, volume, and macroeconomic developments to confirm the next move. A break below this level could open the door for further downside toward 19,000.
USDCHF Bullish Flag: Breakout Targeting 0.94000USDCHF is currently trading at 0.90200, with a bullish flag pattern forming, signaling a potential breakout toward the 0.94000 target. The bullish flag is a continuation pattern that typically follows a strong upward move, followed by a period of consolidation before the next leg higher. If the price successfully breaks above the flag’s upper trendline, it could trigger a bullish wave, pushing USDCHF toward its next resistance levels.
From a technical perspective, the flag’s consolidation phase suggests temporary indecision in the market. However, as long as the price remains above key support levels and breaks out with strong volume, the bullish momentum is likely to continue. A confirmed breakout above the resistance could provide an entry opportunity for traders aiming for the 0.94000 target.
Fundamentally, the US dollar remains supported by the Federal Reserve’s cautious stance on interest rate cuts. Recent economic data from the US, including inflation figures and labor market strength, have kept the dollar strong against the Swiss franc. Meanwhile, the Swiss National Bank (SNB) maintains a relatively dovish stance, which could further weaken CHF and support the bullish case for USDCHF.
In summary, USDCHF is forming a bullish flag pattern, awaiting a breakout for further upside movement. A strong breakout above the resistance level could trigger a rally toward 0.94000, supported by both technical and fundamental factors. Traders should closely monitor price action and key economic events to confirm the bullish continuation.

THEUSDT 100%-130% Gains Potential Ahead!THEUSDT is currently experiencing a strong bounce from a key support level, signaling a potential bullish reversal. This support level has acted as a significant floor for the price, and the bounce suggests that buying pressure is starting to build. The price action indicates that investors are increasingly confident in this level holding, and with good volume behind the move, the chances of the price continuing to rise are high. Traders are targeting gains in the range of 100% to 130%+, as the price moves toward the next resistance levels. This bounce from support has captured the attention of both retail and institutional investors alike, contributing to a surge in interest around this crypto pair.
The good volume accompanying this bounce is a crucial indicator of the move’s strength. In technical analysis, volume plays a key role in confirming price moves, and with the increased trading activity, it’s clear that the market is reacting positively to the support level holding. If the price continues to hold above this support zone, it sets the stage for a potential rally, as the market shifts from a period of consolidation to a more bullish trend. The projected 100% to 130%+ gain is highly achievable if this momentum continues and resistance levels are successfully breached.
Investor interest in THEUSDT is growing, with many seeing the bounce from support as an indication of the start of a new upward trend. As the price breaks through resistance levels, it could trigger further buying activity, pushing the price higher. The solid technical setup, combined with increasing volume and a positive market sentiment, creates an attractive opportunity for traders looking for high-reward setups. The growing interest in this project adds fuel to the fire, increasing the likelihood that THEUSDT will continue to gain in value.
Traders should stay vigilant and monitor the price action closely, paying attention to key levels of support and resistance. If THEUSDT can maintain its position above the support level and push through resistance, it could lead to a substantial price increase, delivering the expected gains. With the current technical indicators and strong market interest, THEUSDT is shaping up to be one of the more promising crypto pairs to watch for significant returns.

Is This the Start of a Crash or Just a Correction?NASDAQ Plunges Amid AI Tech Stock Fears: Is This the Start of a Crash or Just a Correction?
The NASDAQ and NVDA faced a sharp decline today , the fears over AI-related tech stock valuation driving the downturn. This follows a broader market pullback, with the Dow tumbling over 350 points. While some analysts call it a healthy correction, others warn of a deeper risk.
What Just Happened?
Tech stocks bore the brunt of today's selloff as investor sentiment soured on artificial intelligence-related equities. Despite AI’s explosive growth in 2023, cracks in the market narrative are starting to emerge. Leading companies like Microsoft and Nvidia saw sharp declines after investors began questioning whether their sky-high valuations were justified.
From a technical and price action perspective : The index has pulled back into a key demand zone. The current dip has brought prices close to the upward trendline established since December 2022, where the NASDAQ recovered from a 32.84% drop.
Volume Profile: High trading activity around these levels suggests intense market interest and potential support, but if this level breaks, further declines could follow.
So, Is This a Correction or a Crash?
Today’s drop appears to lean more toward a correction than a crash:
Structural Integrity: The NASDAQ remains within its broader bullish trendline. Breaking this line, however, could signal a shift to bearish sentiment.
Technically, demand zones acts as a trampoline or a magnate for the price. If the market bounces here, it may indicate renewed strength.
So, While AI fears rattled the tech sector, the overall economic backdrop hasn’t drastically shifted to signal a systemic crash.
What to Watch Next;
If the index breaks below the current demand zone and closes under the trendline, it could spell deeper trouble for tech-heavy indexes.
Conclusion:
While today's drop in NASDAQ futures and Nvidia has sent a wave of panic through the markets, it’s too early to call this a full-blown crash. Investors should watch key levels closely to determine whether this is a temporary pullback or the beginning of a larger downtrend.

FINAL RALLY IN BITCOIN 5of 5 of 5th wave 109.100/116=113.9The chart posted tonight Is a clear 5 waves is nearing the end of the Bull market since the low in wave 4 at 15980 . WE are advancing in Clean 5 waves down to the 1 hour. WE will see the point of Maximum exposure !! to small traders in this wave . For 2025 I am called for a drop under 21900 23800 For the wave of the long term fractal >Best of trades WAVETIMER !

Silver (XAGUSD): Position Update and New TargetsBack in October 2024, we successfully closed our second position at the exact top of wave 3, capturing the peak before XAGUSD dropped by 17%. We’re still holding our first setup, which remains open with the stop loss set at break-even.
We believe the bottom of wave 4 was established around $29, and the chart now points towards a move higher into wave 5. Our focus is on a continuation above the Point of Control (POC) into the $31.35–$32.90 range. At that point, we’ll look for an entry during the pullback (wave (iv)).
Alerts are set, and we’re ready to capitalise when the opportunity arises.

DOGE ANALYSIS🔮 #DOGE Analysis
🌟🚀 #DOGE is trading in an Ascending Triangle Pattern and here we can see that #DOGE testing the ascending trendline. Also there is an instant major support zone. We can see a pullback from its major support zone.
🔖 Current Price: $0.34820
⏳ Target Price: $0.41960
⁉️ What to do?
- We have marked crucial levels in the chart . We can trade according to the chart and make some profits. 🚀
#DOGE #Cryptocurrency #Breakout #DYOR

Intel aiming to previous two bottomsIntel is probably aiming to harvest a lot of liquidity from the previous two bottoms.

BTCUSD BITCOIN BTC/USD is presenting an ideal opportunity for a sell position if you're targeting a broader downtrend. Alternatively, traders can capitalize on the current market fluctuations with scalping strategies to secure quick, short-term gains. Always prioritize risk management and stay vigilant with your trading plan.

BTC ANALYSIS🔮 #BTC Analysis 💰💰
🌟🚀In 8hr chart we can see a formation of "Rising Channel Pattern in #BTC. Right now we can see that there is an instant support level. We would see a pullback from support level.
🔖 Current Price: $96800
Target Price: $107500
⁉️ What to do?
- We have marked some crucial levels in the chart. We can trade according to the chart and make some profits in #BTC. 🚀💸
#BTC #Cryptocurrency #DYOR #PotentialBreakout

FULL Trading Portfolio Update! How I'm positioningFULL Trading Portfolio Update! How I'm positioning for what comes next in the markets.
In this video, we will discuss:
-How I'm positioning my trading portfolio right now
-All my current H5 trades
-All trades I CUT loose
-What comes next!
Check it out now for all the updates and some great trade ideas
Not financial advice.

XAUUSD TODAY CHART OUTLOOKBased on the analysis of this chart, the market demonstrates a cyclical trend of rising and falling movements. This pattern of fluctuations presents opportunities for significant earnings, as it allows investors to capitalize on both upward and downward trends. Understanding these market dynamics and strategically timing investments during these shifts can lead to substantial financial gains. By leveraging this predictable volatility, individuals or institutions can position themselves to maximize profits in both bullish and bearish market conditions.

#GOLD ANALYSIS UPDATEWorld gold prices increased slightly as the USD dropped. Recorded at 9:45 am on December 17, the US Dollar Index measuring the fluctuation of the greenback with 6 major currencies was at 106,470 points (down 0.08%).
➡️ The gold market is cautious as investors prepare to receive the decision of the US Federal Reserve (FED), which is expected to reduce interest rates with a "hawkish" message after the monetary policy meeting. last of the year.
➡️ Although gold prices maintained a sideways trend ahead of Wednesday's decision, one analyst said the message from the Fed could lead to a larger correction in the precious metals market.
PREMIUM CHANNEL AVAILBLE

GOLD LIVE UPDATE 1HR CHARTXAU/USD Live Market Update: Dive into real-time insights for intraday trading on gold. Stay informed about the latest price action, key levels, and market trends to identify prime scalping and swing trading opportunities. With gold's dynamic nature, this live analysis provides traders with precise entry and exit points, helping you navigate market fluctuations with confidence. Whether you're a scalper looking for quick profits or a swing trader aiming for bigger moves, our updates ensure you're equipped with the knowledge to make informed decisions. Optimize your strategy and capitalize on every opportunity in the XAU/USD market!..
