S&P500 update prior FED Talk short scenario stays intactInterest Rates have been cut 0.25bp as expected, but more importantly what will Jerome Powell tell us during his speech? My short setup (WXY Corrective Structure) as shown before stays in tact as long as we don't break above the price area marked in orange on the chart. After the meeting we should know more. Be save in the Markets
Update

Update Gold for follower that ask me in pmHi
I have many pm so I would like to summanry in this idea.
As I have early priate idea that have old entry around 1496 , 1528
If you still keep this nothing to do because I think you partial close and let it run as it can go.
What 's next !
I see daily chat .
from 1160 it have big move around 3 step and now in step 4
it move around 1600 - 1300 -1000 pips
it is decreasing if i calculate to forcast next move . It should move around 700 pips ( 1557-1568)
Yes, If I am right This move will go around 1557-1568
and will retracement again and check direction again.
Now we near supply zone in weekly timeframe ( gray zone)
It may drop sharply or hugh Break up.
Nothing is 100% sure ,Only good money management can help you survive.
Yes It is only my opinion . but what to do it is depend on your account and strategy.
Hope it may a little bit help.
Trade with cauton and don't forget to protect profit.
Cheer,
Theo.

Back Above Daily KamaThe market is still flat although the bitcoin has managed to return above the Kama average in a position of strength after several weeks below it.
A break above the resistance zone (above 12200$) would confirm the recovery of the trend.
From tomorrow i'm on holiday, see you in September, there will be updates only in case of emergencies:)

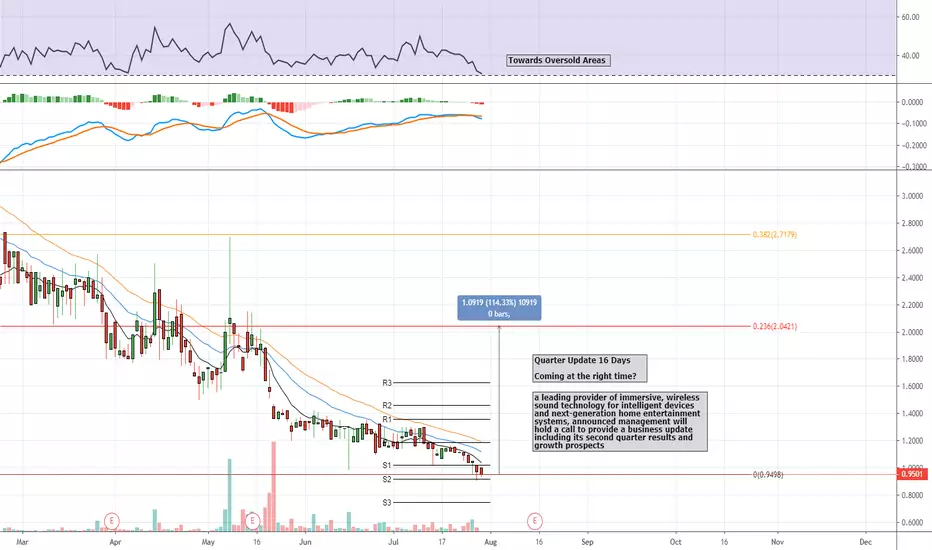
WISA - Quarter Update In 16 Days - HIGH RISK HIGH REWARDA leading provider of immersive, wireless sound technology for intelligent devices and next-generation home entertainment systems, announced management will hold a call to provide a business update including its second-quarter results and growth prospects
Summit Wireless Technologies Inc., formerly Summit Semiconductor, Inc. is an early-stage company that develops and sells wireless audio integrated circuits for home entertainment and professional audio markets. The Company develops and provides semiconductors and wireless audio modules to consumer electronics companies, which transmits and receives audio directly to speakers. Its technologies focus on providing wireless, interference free and uncompressed high-definition audio signals. Its subsidiaries include Summit Semiconductor, Inc., Summit Semiconductor K.K., and WiSA, LLC.
Average Recommendation: BUY
Average Target Price: 4.00
P/E Current
-0.11
P/E Ratio (with extraordinary items)
-0.29
SHORT INTEREST
72.01K 07/15/19
This is a very risky trade, we recommend waiting on this one, maybe set alerts for close to the time of announcements. Clear direction in chart movement is required with tight-stops.
XAUUSD update FocusedFortuneFXGold drewback a fair bit, i adjusted my stops to closer to the 1400 region, and we have woke up to still a bullish bias on gold where we can see price at a key level around 1420, which we may have some slight resistance at. We need to keep watching this key level closely for a break of the area of confluence so we can continue our journey to the upside.
added more positions at 1413 (currently up around 70 pips)

Market & Bitcoin Update — The tide is starting to moveBitcoin Update
In the past history we had affirmed the possible formation of the cypher harmonic pattern in H4 & D1 time frame.
Bitcoin is still trading below its 100-day EMA line and seems to be challenging it today.
RSI level is at ~50 more or less when it was written this update.
If we look the recent chart, that harmonic pattern was confirmed when the Bitcoin touched the closed support around USD $ 9k.
In the past hours we were surprised with the large volume of capital entering the market and the possible long openings by the investors.
And most surprising, the massive liquidation of short in bitmex. Near to $ 58.1 Mil USD were liquidated.
What is the future?
Currently we have a low channel wanting to be broken in D1 and the price is touching the ema21, — an important indicator that can be considered as support and resistance; indicating the start of a pullback.
To confirm a new high trend, we need a new buyer candle to be positioned above the ema21 — ema50, around $ USD 11.5k — $ USD 12k, one region that can be considered low risk for opening a long positions, if it is your strategy.
We still do not rule out the possibility of forming the patron three white soldiers. Which would also help confirm the new high trend and the long-awaited reversal.
Otherwise we can have a false break, which would trigger the continuation of the downward trend. If the above comes to pass we can test lower levels of support and $ USD 9K+.
On the other hand, we suggest that to make a successful operation, wait for the MACD indicator to cross in the next few days.

link - updatelink - update
updates its minimums asset)
I think we will go much lower!
the only level that will keep us
it's 2 dollars

Sia v1.4.1 is out - Important milestone!Sia v1.4.1. is here!!!! For the first time ever, it is possible to backup files stored to Sia using just the wallet seed. The process is FULLY decentralized and does not depend on any third party services nor require any information to be sent to any Sia servers.
This release contains substantial improvements to create a cleaner, smoother, more comfortable, and more scalable experience. While using less memory and computation than v1.4.0, the new version is able to handle more than 20 TB of data spread across hundreds of folders with thousands of files each. The UI has also seen significant improvements, including support for the long-awaited dark mode. File management within the UI has also been significantly improved, and now includes sorting for files, and the ability to drag files into other folders.
The Sia team has been working hard to improve the state of the art, and v1.4.1 is unquestionably the best decentralized data storage product built to date.
...and that is just the beginning.. Well done Sia team! Fck Google or any other 3rd party services - this is the same revolution like BTC but in cloud storage area.

BTC FLASH UPDATE - BULLISH DUMP?! Bitcoin! (BTC)Hello Friends, Traders, everyone..
you all know how much I love anything based in fibonacci. Well, I just wanted to throw this out there, something I found.
There are plenty of trading opportunities in this market! But I think we can all agree, Bitcoin is taking a breath here. I really want to see Bitcoin shatter that next Fib Circle resistance and moon, here's how we could do it!
Good luck traders...


ETH - update ideas
“Ethereum needs only 10 dollars to reach 285 dollars and justify our forecast made a few days ago. Even a record transaction volume of 1 million per day can prevent the lead altcoin from falling below $ 300.
On the 4-hour chart, Ethereum monitors BTC price movements, showing a decline since June 26. However, one should not expect a drop to $ 250, since the RSI model is moving into the oversold zone. MACD is declining, indicating an early decline to 270 dollars.

btc hell or heaven ?there is cross line you can see its big important mark its is 11640 up to 11670
if btc get out cross line and go higher this rate you should sit your belt tightly and ready to btc act like bomb going to 20 k ...
if btc could not get pass through this cross line
make yourself ready going to heal that at last became beauty heaven for those one who buy some btc again .
its up to you choose which one you like ? right it down your comment bellow here

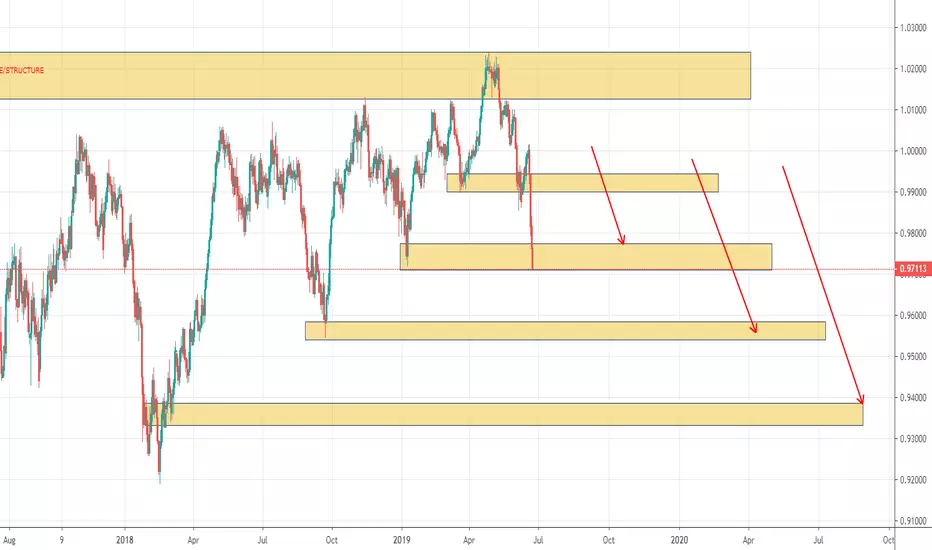
USDCHF SHORT PROJECTION (UPDATE) IF YOU LOOK AT USDCHF YOU CAN SEE THAT THE MOMENTUM HAS BEEN ON THE SELLER SIDE AND THIS PAIR HAS BEEN ON THE MOVE TO THE DOWNSIDE. I HAD MADE A POST LAST WEEK SHOWING THE SIGNIFICANT STRUCTURE LEVELS I THINK THIS PAIR COULD POTENTIALLY VISIT. IT HAS ALREADY HIT 2 OF THOSE LEVELS AND BASED ON MOMENTUM IS LOOKING LIKE IT STILL HAS A WAYS TO GO. KEEP AN EYE ON THIS PAIR AND HOPEFULLY YOU'RE CATCHING OPPORTUNITIES FOR SHORTS ON THE WAY DOWN AS LONG AS MOMENTUM PERMITS YOU TO DO SO. KEEP AN EYE OUT!
CHEERS!
USDCAD UpdateWell there you go,USDCAD short TP targets have been reached by a massive bear movement which looks to be still going down at the moment Potentially it will be looking to go the 1.31200-1.30743 areas.Do follow me and like, for daily posts on high probability analysis.

Oil Sell Idea UpdateThe idea we've been following in Oil is now starting to become relevant. The price reached the top of the H4 chart range. There is still room for another push higher though.
We can split the potential scenarios into 3.
Scenario #1 - Another push higher then reversal from the zone marked.
Scenario #2 - Immediate continuation lower, bouncing from the 100% extension and the beginning of the top zone of the range.
Scenario #3 - Of course would be the invalidation. This is where the price breaks above the top of the range and creates momentum.

EURJPY updateEURJPY looked to push up into our profit area and then had a retracement back to our entry point but now currently it looks like the bulls want control.Will keep you updated as price moves further.

USDCAD UpdateIf you watched my previous analysis on the USDCAD,You can now see that Price is starting to drop and has also just recently broken a price action structure on the H1 chart i personally have already put my stop at break-even so that the trade is now risk free.Will keep you updated as the market moves a bit more.


Smart Sell Level on Bitcoin 8145 AreaBitcoin long completed successfully today from down below 7655, to Sell at 7985.
a further analysis with the Gann box shows a good alignment of Time & Price.


Crypto Market Recap! 5/17/19! BTC FLASH CRASHHello everyone!
Here is my Weekly Digital Currency Update.

ETH/USD Where is it going to?Hello Friends,
I will update this chart with expected targets if there is enough interest from the community. If the community wants more details, please show your interest by hitting the like icon .
Looking at the daily chart we can see a rising wedge after a long down trend since the peek of the market. Has ETH hit bottom or is another bottom still in the cards?
All I can say at this point is the RSI has turned downward along with the MACD in tow. The RSI is showing a divergence yet there is a fractal signal giving indication to stick it out for now. The bollinger bands have turned inwards for a possible squeeze, forcing out whatever juice that remains of this trading pair. Despite the SMA golden cross and its SMA 100 predecessor, we haven't seen much action. The 50 is looking temporarily as support but the pattern will dictate the outcome as will sentiment in the market.
Looking at the weekly chart the RSI is neutral yet curling towards the bottom but the MACD is showing mixed signals and continues to climb. Volume has significantly decreased since November yet we are watching a decline in price. So which way is it going?
I have an answer but that will require an interest in the community.
Cheers!

EUR/USD-->Update My Previous Chart Hello to all of you,
Because of the fluctuation on the markets, I thought that it will be useful to do another analysis for updating the latest on Eur/Usd .
After the good news and the decrease of bearish pressure, as we pass the resistance and stable at the first yellow line, we can search for the best entry like I said in the previous analysis.
Furthermore, I have drawn for you the demand and supply zones, specifically the demand zone is the area that Big Buyers are taking control of the market, in contrast the supply zone is the level that the Sellers short big amounts. Therefore, I expect the price to touch the second or the third yellow resistance horizontal lines and after that to decline with target the supply zone.
But remember, we have to see a confirmation signal from the price action in order to start putting entries and stop losses to this trading plan.
But the bias remain Short.
You can join if you like in my free telegram group, I am trading almost 2.5 years, you are more than welcome.
Thank You,
