CADJPY BREAKOUT TRADE Pair: CADJPY
Timeframe: 1H
Analysis: Round number level, trend line, volume profile, support and resistance
----------
Key Takeaway: Seen a break of trend and resistance
—————
Level needed: Need to see price close by 104.965
—————
Trade: Short
RISK:REWARD 1:11
SL: 28
TP: 317
—————
DO NOT ENTER OUR SETUPS WITHOUT CONFIRMATION
Update

EURAUD TREND BOUNCE SETUPPair: EURAUD
Timeframe: 1H
Analysis: Round number level, trend line, volume profile, support and resistance
Key Takeaway: Need to see a bounce from trend line, high volume level and round number
—————
Level needed: Need to see price close by 1.46030
—————
Trade: Long
RISK:REWARD 1:7
SL: 28
TP: 195
—————
DO NOT ENTER OUR SETUPS WITHOUT CONFIRMATION

CHFJPY ASCENDING TRIANGLE BREAKOUT Pair: CHFJPY
Timeframe: 4H
Analysis: Round number level, trend line, volume profile, resistance, ascending triangle pattern
Key Takeaway: Need to see a break of ascending triangle and round number
—————
Level needed: Need to see price close by 139.695
—————
Trade: Long
RISK:REWARD 1:7
SL: 32
TP: 216
—————
DO NOT ENTER OUR SETUPS WITHOUT CONFIRMATION

GBPUSD HEAD AND SHOULDERS PATTERN Pair: GBPUSD
Timeframe: 4H
Analysis: Round number level, trend line, volume profile, resistance, head and shoulder pattern
Key Takeaway: Need to see a bounce from high volume level and resistance
—————
Level needed: Need to see price close by 1.21457
—————
Trade: Short
RISK:REWARD 1:13
SL: 30
TP: 380
—————
DO NOT ENTER OUR SETUPS WITHOUT CONFIRMATION

CADJPY HIGH VOLUME BREAKOUT (UPDATE)Smashed TP1/2 leaving us with 34 pips profit already, we are currently seeing a pullback but holding last position to tp3, well done if you took this one

GBPNZD TREND LINE BOUNCE Pair: GBPNZD
Timeframe: 4H, 2H
Analysis: Round number level, trend line, volume profile, resistance,
————--
Key Takeaway: Seen bounce off resistance and bearish pressure against trend line
—————
Level needed: Need to see price close by 1.94025
—————
Trade: Short
RISK:REWARD 1:16
SL: 15
TP: 235
—————
DO NOT ENTER OUR SETUPS WITHOUT CONFIRMATION

CHFJPY SUPPORT BREAK (UPDATE)Smashed through all take profits, prices dropped like a sack of potatoes, managed to profit around 165 pips for this trade

GBPUSD BREAKOUT (UPDATE)TP1/2 smashed out the park, just hit the high volume level so we will see how price reacts to this and decide what to do with the last position from there

GBPCAD BREAKOUT (UPDATE)Easy breakout trade here managed to grab TP1/2 and now have SL to b/e and going to take it to the moon, well done if you managed to grab this setup when we posted it

USDJPY CONTINUATION TRADE (UPDATE)Bounced beautifully off these key levels leaving us in 50 pips profit, great stuff

GBPJPY PENNANT BREAK (UPDATE)Seeing some lovely bearish momentum now and in around 40 pips profit, we are going to keep holding when we see signs of the pair running out of bearish steam

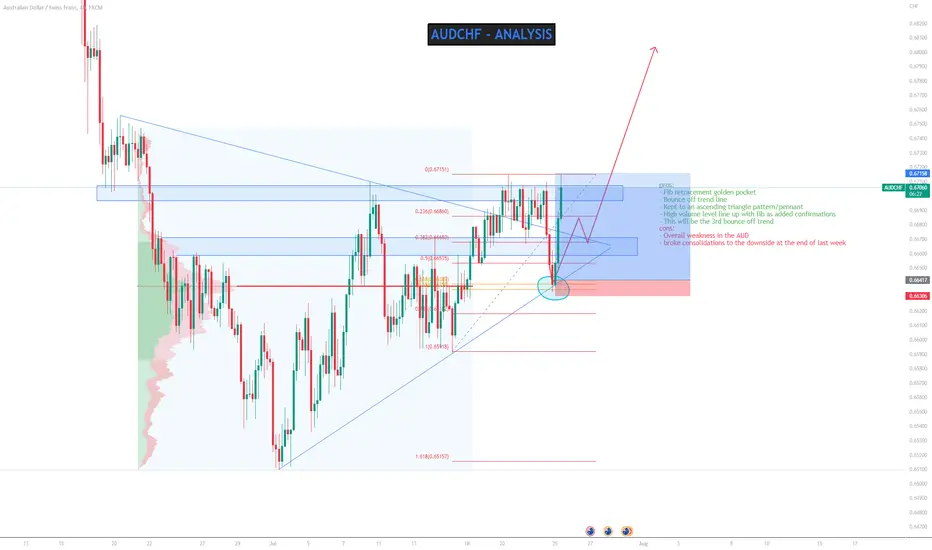
AUDCHF CONTINUATION TRADE (UPDATE)We predicted this move exactly with multiple confirmations. With a great risk:reward we saw price immediately fly up from this key level we pointed out yesterday
CADCHF PENNANT BREAK (UPDATE)Pennant break went perfectly to plan and we are seeing a 25 pip profit already. Going to keep holding until we hit support and ultimately decide what happens from the reaction we see when it does

TradingView Binance All Futures USDT Pair TXT Import USDⓈ-M This is All Pairs List for USDⓈ-M Binance Futures 2022
Last Update: 23/07/2022
171 Pairs:
binance:1000luncbusdperp
binance:1000shibbusdperp
binance:1000shibusdtperp
binance:1000xecusdtperp
binance:1inchusdtperp
binance:aaveusdtperp
binance:adabusdperp
binance:adausdtperp
binance:algousdtperp
binance:aliceusdtperp
binance:alphausdtperp
binance:ancbusdperp
binance:ankrusdtperp
binance:antusdtperp
binance:apebusdperp
binance:apeusdtperp
binance:api3usdtperp
binance:arpausdtperp
binance:arusdtperp
binance:atausdtperp
binance:atomusdtperp
binance:audiousdtperp
binance:avaxbusdperp
binance:avaxusdtperp
binance:axsusdtperp
binance:bakeusdtperp
binance:balusdtperp
binance:bandusdtperp
binance:batusdtperp
binance:bchusdtperp
binance:belusdtperp
binance:blzusdtperp
binance:bnbbusdperp
binance:bnbusdtperp
binance:bnxusdtperp
binance:btcbusdperp
binance:btcdomusdtperp
binance:btcusdtperp
binance:btsusdtperp
binance:c98usdtperp
binance:celousdtperp
binance:celrusdtperp
binance:chrusdtperp
binance:chzusdtperp
binance:compusdtperp
binance:cotiusdtperp
binance:crvusdtperp
binance:ctkusdtperp
binance:ctsiusdtperp
binance:cvcusdtperp
binance:cvxbusdperp
binance:darusdtperp
binance:dashusdtperp
binance:defiusdtperp
binance:dentusdtperp
binance:dgbusdtperp
binance:dodobusdperp
binance:dogebusdperp
binance:dogeusdtperp
binance:dotbusdperp
binance:dotusdtperp
binance:duskusdtperp
binance:dydxusdtperp
binance:egldusdtperp
binance:enjusdtperp
binance:ensusdtperp
binance:eosusdtperp
binance:etcusdtperp
binance:ethbusdperp
binance:ethusdtperp
binance:filbusdperp
binance:filusdtperp
binance:flmusdtperp
binance:flowusdtperp
binance:ftmbusdperp
binance:ftmusdtperp
binance:fttbusdperp
binance:fttusdtperp
binance:galabusdperp
binance:galausdtperp
binance:galbusdperp
binance:galusdtperp
binance:gmtbusdperp
binance:gmtusdtperp
binance:grtusdtperp
binance:gtcusdtperp
binance:hbarusdtperp
binance:hntusdtperp
binance:hotusdtperp
binance:icpbusdperp
binance:icxusdtperp
binance:imxusdtperp
binance:iostusdtperp
binance:iotausdtperp
binance:iotxusdtperp
binance:jasmyusdtperp
binance:kavausdtperp
binance:klayusdtperp
binance:kncusdtperp
binance:ksmusdtperp
binance:leverbusdperp
binance:linausdtperp
binance:linkbusdperp
binance:linkusdtperp
binance:litusdtperp
binance:lptusdtperp
binance:lrcusdtperp
binance:ltcbusdperp
binance:ltcusdtperp
binance:luna2busdperp
binance:manausdtperp
binance:maskusdtperp
binance:maticbusdperp
binance:maticusdtperp
binance:mkrusdtperp
binance:mtlusdtperp
binance:nearbusdperp
binance:nearusdtperp
binance:neousdtperp
binance:nknusdtperp
binance:oceanusdtperp
binance:ognusdtperp
binance:omgusdtperp
binance:oneusdtperp
binance:ontusdtperp
binance:opusdtperp
binance:peopleusdtperp
binance:qtumusdtperp
binance:rayusdtperp
binance:reefusdtperp
binance:renusdtperp
binance:rlcusdtperp
binance:roseusdtperp
binance:rsrusdtperp
binance:runeusdtperp
binance:rvnusdtperp
binance:sandbusdperp
binance:sandusdtperp
binance:sfpusdtperp
binance:sklusdtperp
binance:snxusdtperp
binance:solbusdperp
binance:solusdtperp
binance:srmusdtperp
binance:stmxusdtperp
binance:storjusdtperp
binance:sushiusdtperp
binance:sxpusdtperp
binance:thetausdtperp
binance:tlmbusdperp
binance:tomousdtperp
binance:trbusdtperp
binance:trxbusdperp
binance:trxusdtperp
binance:unfiusdtperp
binance:uniusdtperp
binance:vetusdtperp
binance:wavesbusdperp
binance:wavesusdtperp
binance:woousdtperp
binance:xemusdtperp
binance:xlmusdtperp
binance:xmrusdtperp
binance:xrpbusdperp
binance:xrpusdtperp
binance:xtzusdtperp
binance:yfiusdtperp
binance:zecusdtperp
binance:zenusdtperp
binance:zilusdtperp
binance:zrxusdtperp

GBPAUD PENNANT BREAK (UPDATE)As soon as we broke out from this pattern we saw an immediate drop in price. We are currently in around 60 pips profit and still running, due to the strength of AUD we will be holding until things change

USDCAD REVERSAL TRADE (UPDATE)Seen a massive swing in bearish momentum and currently in 50 pips profit, going to exit at the next rounded number

Monster Run Starts 7/11Updated details from my post on Friday 7/8. That was done in a hurry with the primary message being "seize the opportunity and Buy while its still in the 700s"... Here are my expectations after running a full analysis - I should note that the method I am using to calculate targets is my own, the Elliot Wave shown is just a supplemental check I use to confirm the move I am seeing coming using my method is plausible with respect to the larger structure:
- Pre-earnings target = 917.61, with the most explosive part of the move coming next week (7/11/2022 - 7/15/2022). There might be some resistance around 822-853, but I think it has the setup to squeeze right past it with consecutive big green days.
- After testing low 900s as a sign of strength, it might pullback/consolidate going into earnings. Post-ER target range is 955-984, and in the right environment it can even test the major resistance around 1150. I'll re-eval from there when the time comes.
Markup was activated with a break above 747.90, and then close above deep purple trendline Friday 7/8. We already got a taste of TSLAs strength above the 747 after hours 7/8 when if got to as high as 777 after Elon withdrew from the Twitter deal. He knows what he's doing.
Regards,
Grimes
we are from the dimension that exists in Your future, translated in Our past via R.E.M. within the dimension that exists in Your present... or did

ADA Cardano VASIL Hardfork DetailsHI Friends.
Today i decide to explain more about coming upgrade in cardano blockchain.
without wasting time lets go friends.
Vasil Hardfork: Another Network Upgrade On The Cardano Blockchain
A hardfork is a software upgrade to a blockchain’s network, making previously invalid transactions and blocks valid.
While many blockchains rarely do the hardfork, Cardano (ADA) is a sort of blockchain that experiences periodic improvements every year.
After their first hardfork, Alonzo, now Cardano is on track to implement another fork called the ‘Vasil hardfork’.
Vasil hardfork is the second massive upgrade to the Cardano network that focuses on overall network stability and connectivity.
With Vasil, pipelining testing, new CIP mechanisms (CIP-31, CIP-32, CIP-33, CIP-40),
UTXO on-disk storage integration, and Hydra will be introduced as added functions.
once Vasil hardfork is completed, Cardano will receive a higher throughput
and an enhanced range of decentralized finance (DeFi), decentralized exchange (DEX), and smart contracts.
These enhancements are derived from the scaling improvements of the network as stated earlier,
including pipelining tests, improved logging, the release of four CIPs: CIP-31 (Reference Input), CIP-32 (Inline Datum), CIP-33 (Reference Script), and CIP-40 (Collateral Output), UTXO HD and Hydra integration.
CIP’s Explanation:
CIP-33 is expected to significantly reduce transaction costs, by making transactions small and “lightweight”
CIP-31 will facilitate Decentralized Apps (DApps) to access transactional output without having to recreate it as before.
CIP-32 introduces an on-chain data storage for the community and developers, thereby making Cardano a “truly decentralized architecture”.
CIP-40 executing a Plutus Smart contract requires a collateral amount, which means users must include a fee to cover the cost of executing the script.When a transaction fails validation, said collateral is completely lost. CIP-40 changes this by including just enough collateral in a transaction for it to go through and setting a limit to failed transactions, so it can only lose a minimum amount of collateral.
Despite several crashes and bearish market cycles at the moment, ADA still performs well and ranks in the top 10th percentile on the crypto market, based on its market capitalization
this upgrade scheduled to happen in 29 june 2022 but its delayed for next month july.
thank you for your reading and your support.
hope to like this post.please share me your opinion in comments.

Bitcoin in 1 Minute - Day 15Hello TradingView Family / Fellow Traders. This is Richard, as known as theSignalyst.
I started a new series where I will analyze Bitcoin in 1 minute for 500 Days!
Let me know if you like the idea.
Always follow your trading plan regarding entry, risk management, and trade management.
Good Luck!.
All Strategies Are Good; If Managed Properly!
~Rich

EURAUD TRADE UPDATE! In PROFIT ✅🏁Welcome back! Here's an analysis of this pair!
**EURAUD TRADE UPDATE & RECAP- Listen to video!
We recommend that you keep this pair on your watchlist and enter when the entry criteria of your strategy is met.
Please support this idea with a LIKE and COMMENT if you find it useful and Click "Follow" on our profile if you'd like these trade ideas delivered straight to your email in the future.
Thanks for your continued support!
Brian & Kenya Horton, BK Forex Academy

BTCUSDT PRICE SQUEEZE + QQQ CORRELATIONImportant things to note:
This is just a small update with small adjustments to my targets.
If you would like me to make a video version of these updates, let me know in the comments.
A quick video overview of BTC and the markets would be easier for me to put out more often via video.
We are currently going on our 9th red week and I have to be honest, I just do not see another down week happening.
Price has been staying in area of interest and squeezing.
QQQ correlation has been falling daily since May 12th.
I have adjusted the price targets by a small amount.
The Volume we had on the drop across all markets is significant.
I have also adjusted the symmetrical triangle to account for the price movements.
It would make sense that the price would squeeze higher and test the trendline.
I expect the trendline test to get rejected due to the overall bear market.
Tightening starts June 1st which would spike the price is the market shutters.
Hey everyone! I just wanted to give you a quick update since I have adjusted a few things and have looked at the overall market during the weekend. Also, it would be easier on me if I could just make a video update every few days going over the tradfi market, derivatives, crypto and anything else I see going on. If this is something you would rather see versus reading me ramble on, please let me know in the comments. I would still put out charts, but it would save me some writing time. Anyways, so I have been thinking about the fact that we are going on our 9th red week and to be honest, it cannot sustain the same momentum forever. I think this would be a good time for the price to squeeze upwards towards 33k while simultaneously testing the trendline. I also expect that the trendline test would be rejected. The lows will need to be tested eventually and that would also fall in line with the fed tightening. I do not expect the market to puke the very day that the tightening begins, but that week or the following week seems likely if the credit market starts to shake. I have also put the downside risk on the chart as well so you know where I expect price to go if things go wrong. I should also note that you can clearly see the correlation to QQQ start to fall little by little. The thing is, BTC is cheap compared to QQQ if you look at the average distribution. So I expect that at these levels, people are going to keep stacking. The volume across all exchanges should also be of note because it was absolutely massive. It is clear the market panicked hard during the last drop, and that makes people oversell. As a bull, that is exactly what you want to see because it creates a price floor that is difficult to break. That's it for today folks! Thanks again and let me know what you think about quick video updates! It will just be me going over things I am looking at currently. Till next time!
So tell me what you think?
Not financial advice. Do your own research.

This aged well. Hope you did too.Well, the wedgie from hell is on it's way there. Probably find support around 290.

Bitcoin continues to work out the support area#BTC Main 17.06.2022📊
BTC: $ 20,400
ETH: $ 1,000
BITCOIN DOMINANCE 44,97%
TOTAL MARKET CAP $ 0.86T
Crypto Fear & Greed Index: 9
📊Bitcoin continues to work out the support area of $19.980 - $21.370 perfectly so far.
On today's daily candle, it is very important to observe the volume that enters the market from the buyer's side in order to understand the degree of protection of the level.
Sentiment does not allow us to move up yet (and it is unlikely to allow it in the coming weeks), but it is too early to go down, since there is no liquidity in the region of 20 - 23k $ 🤷♂
Have a good trading day👌
