UPS
Daytrading RECAP 04/08/20 - 3 Longs & 1 Short for +1.6%!Hi traders,
Tom with another recap here.
*In my ID trades, I risk 1% of the account per trade and go for 2% (2:1 RRR ). Sometimes I adapt a little bit as you can see in the description.*
I switched to video recaps so you can see the charts in greater detail. Let me know if you like it!
Four trades today:
1) UPS - LONG @95.04, stopped out at 94.27 for a little under -1%
2) T - SHORT @29.62, closed half at 2:1 and the rest at B/E (messed that up). Total profit a bit over +1%
3) NVAX - LONG @16.75, closed half at 2:1 and let the rest run some more, closed just before 18 for a total of +2.5%!
4) PINS - LONG @16.9, the stock couldn't hold the pressure and collapsed into my SL @16.4 for -1%
Total PnL for the day: +1.6%
Total PnL for the week: +2.05%
In hindsight, I left money on the table with T and should've reversed PINS after it stopped me out and showed big pressure to the downside.
Mistakes are great teachers for your trading, learn to accept them and work with them!
Good trades and let me know how your Wednesday trading went!
Tom from FINEIGHT
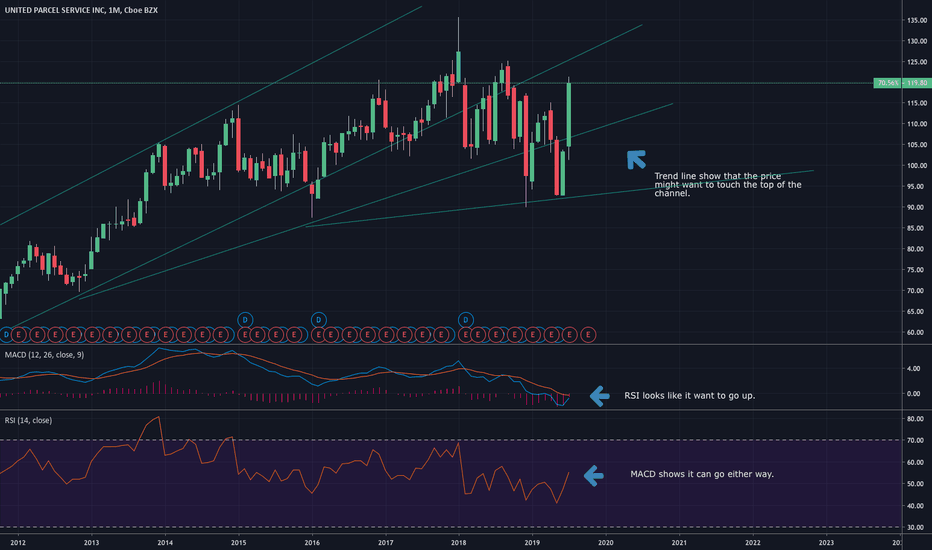
UPS: Double Bottom and Buy OpportunityIf the price breaks the local swing high, a double bottom chart pattern will be confirmed. It will give us a buy signal based on the breakout.
RSI confirmed the price reversal from 102.00 support. MACD is bullish.
If the price moves back to the support zone, it will be possible to buy using reversal signals from the daily and hourly timeframes.
Disclaimer!
This post does not provide financial advice. It is for educational purposes only! You can use the information from the post to make your own trading plan for the market. But you must do your own research and use it as the priority. Trading is risky, and it is not suitable for everyone. Only you can be responsible for your trading.
UPS long Trend line playMissed the perfect entry as we gapped up. small position in already, will add on if we hold the current zone. If you have questions about the trendlines and horizontal area of interest (zones/colors/ meanings etc) you will have to DM me as it is too involved to go over in a comment. Happy to communicate though, just give me a little time.. Happy trading and stay green!
Bullish S/R flip and DMA Golden Cross on UPS.UPS is currently building support on top of old resistance around $112 (which confirms the bullish support and resistance flip), and is consolidating in what looks to be a bull flag-like pattern. We also have a daily golden cross (50 day moving average crossing the 200 day moving average) and we could see the momentum continue to carry this stock higher. R/R is pretty good here, but I've had what I thought were good setups turn south pretty quickly (EA and SQ for example), so be cautious and use proper risk management if you decide to take this trade.
Moving average guide (All daily for this post):
50 day moving average in Green.
100 day moving average in Yellow.
200 day moving average in Red.
Entry: 112.30-114.50
Target 1: 118.00
Target 2: 120.60
Target 3: 125.00
SL: 110.50 (below the 50 and 200 day moving averages, and below our support zone at 112.)
-This is not financial advice. Always do your own research and own due-diligence before investing and trading, as for investing and trading comes with high amounts of risk. I am not liable for any incurred losses or financial distress.
UPS approaching resistance, potential drop! UPS is approaching our first resistancce at 111.51 (horizotnal swing high resistance, 78.6% fibonacci retracement, 61.8% fibonacci extension) where a strong drop might occur below this level pushing price down to our major support at 103.68 (horizontal pullback support, 38.2% fiboancci retracement).
Stochastic (89,5,3) is also approaching resistance where we might see a corresponding drop in price.
"Never let them ride yo wave" -Quavo, Portland 2017ok boys
mr. elliot, can i ride ur wave?
shout out to quavo open.spotify.com
dont ever let them ride yo wave
so we got some memes on this chart, shout out to @tonevays, beast TD indicator god tybg
we got no higher high on the 6 7 candle sequence, lets see if we dump past this red 1 otherwise superwave 5 is valid, mmkay?
after that exit all crypto markets, they are about to bogandoff that shit forreal this time
from the ashes , will rise a phoenix backed by Goldman Sachs llollllll plebs
lets get this
BTCUSD: Bitcoin Saturday Trade Set-Ups for the Aficionado
Bitcoin Saturday Trade Set-Ups for the Aficionado
BTCUSDT
BTCUSD: Bitcoin Saturday Trades for Die-Hards
A slow overnight session has given way to a slow start to Saturday trading.
Bitcoin has held up though and if still long here is about 80 points up on the last entry at 7375.
Looks like we're stuck with scalping still for now looking at the lack of interest in Europe this morning. The tight range and lack of volume suggests we're going to have to be happy enough with 90 to 200 point scalps at best this weekend.
Am raising the stop to 7449 for now on rest of this long position and looking for some interest to pick up later when US opens.
If it breaks the stop in the meantime will be looking to buy again off the dynamic with stop about 20 lower.
Alternatively can raise the stop to 7409 for smaller profit if hit and run it, looking for 7530-7540 initially and then 7652 once 7540 can be broken above.
Got two thirds of this long left.
Maybe will do one third and one third as above...in doubt so doing both is easiest way to handle this predicament for now.
On the downside Bitcoin has to break below 7410 on Tether feed to turn negative again - can reverse short from this point if looking to trade the next move, which should bring it down to 7360 initially where it will likely bounce again unless we see some decent volume building fast behind it (less likely on a weekend but still possible if whales are around - where are they all? They used come out to feed on weekends once upon a time. Been a long time.)
After bouncing again at 7360 back towards the underside of the dynamic at best it should then fall back to 7300-7280 at least and if not to 7211. Depends on volumes really.
This pattern looks to be just another continuation pattern within the overall downtrend so far. Although it's near term mildly positive the chart is still saying it has to come lower yet before we can call a real bottom.
Any break below 7211 offers a bigger short potential and can be followed back to 6815-6743.
20:37 Bst 15:37 Est Friday
Bitcoin Bitmex Update.
There was no volume on the break higher but it was still worth following for 100 -140 points from 7400 as it broke the upper dynamic.
Now it's come back to test the same dynamic from above. Should hold here and gives a chance to get long at low risk because the stop is close by.
It may not work. But the loss is small if so.
Stops below 7355 - can put an order in at 7375 - loss 20 .
For Bitcoin updates in real-time please check the link, top-left of main page. Aficionados only ; )
And if you find these updates interesting from time to time please hit that button. It's the only way there is of knowing if it's worth carrying on updating via Tv. Thanks
Bitcoin: BTCUSD Bitcoin Trade Set-Ups from HereBitcoin Bitmex Chart Update XBT
After 36 hours of consolidation Bitcoin has held above the key 7265 level after a spike low at 7243 on this feed and since
then has survived a couple more retests. It's not ready to fall away yet therefore.
Looks as if it will make another attempt to touch 7615 and maybe spike into the uppermost parallel again as yesterday -
this would take it to the the next line of resistance at 7675 at best before it comes off again - unless we see volume rising
fast again at that point.
On Bitmex feed it's still effectively stuck in the range bounded by three lines of important resistance at 7615 and 7683 and
7741 and one line of support at 7265, which now needs extending to cover the spike low.
Whilst inside the range it looks like scalping opportunities at best for now.
Buy on dips towards the 7355 nearest support line with stops just under 7350 looks to be the best option for those looking
to trade this inside the range from here.
For others, an eventual break either side of the range should be worth following more aggressively.
Has to break above 7750 on high volume to follow long looking for 8600.
And on the downside has to break below 7240 on rising volumes for next good shorting opportunity, looking for a
retest if 6819-6792 range where it should bounce again if tested.
But until then it looks like scalping opportunities inside the range.
For more active traders: For Bitcoin updates in real-time please see link at top left of main page
For Continuity: 18th July - Bitcoin Chart Updates
(For all updates since last Bitcoin Update on Tv a month ago can be checked via link at top left of main page)
This is a long update - you can skip most of the BS below by scrolling down to the final paragraph.
We're at a tricky point, or getting very close to it now. So have tried to give reasoning as best as possible below.
Futures
Bitcoin held up just above the 7266 support/stop line and then pushed nearly 300 points higher still to a 7560 high overnight before falling away again.
The upside target on this feed remains the 7615-7756 range but must admit to not really liking the pattern it's making right now however - am thinking of raising the stop to 7419 - which may well get taken. Otherwise stop has to remain under the 7266 line here, as overnight.
Looking for clues to the next move from here.
It looks like a grind higher so far, rather than another big volume green candle about to come. Keeping an eye on the volume itself will help to confirm or negate this.
Without it Bitcoin still stands a chance of spiking to the 7615 line in the nearterm but is likely to come off again if it makes it there - unless volume is rising very fast underneath it.
So upside is 180 or so points probably in the near term and downside is 180 or so to 7266.
So as risk/reward ratio is now only 'evens' either side, staying with this long is slowly turning into an act of bravery and defiance over mere calculation at this point in the game.
So caution is warranted again here.
To add to overhead resistance there's a spooky set of upper parallels forming at the highs overnight.
Was thinking these were a case of pareidolia - the invisible spectre that sits at all TA's tables alongside them.
It's bad enough to see things that aren't really there without spreading them around others. It's like spreading a virus ! Who needs it?
(Unless it's a pattern spotted that warrants further investigation via the chat room - which is what we're all here for in the end, presumably.)
Anyway, these two upper parallels do look as if they are in play now and are holding back rally attempts quite effectively so far.
The volume on Tether is showing roughly half the volume bar to left of chart, the start of the last decent counter rally.
It implies that the rally is running out of upside interest from here.
For more please check the link