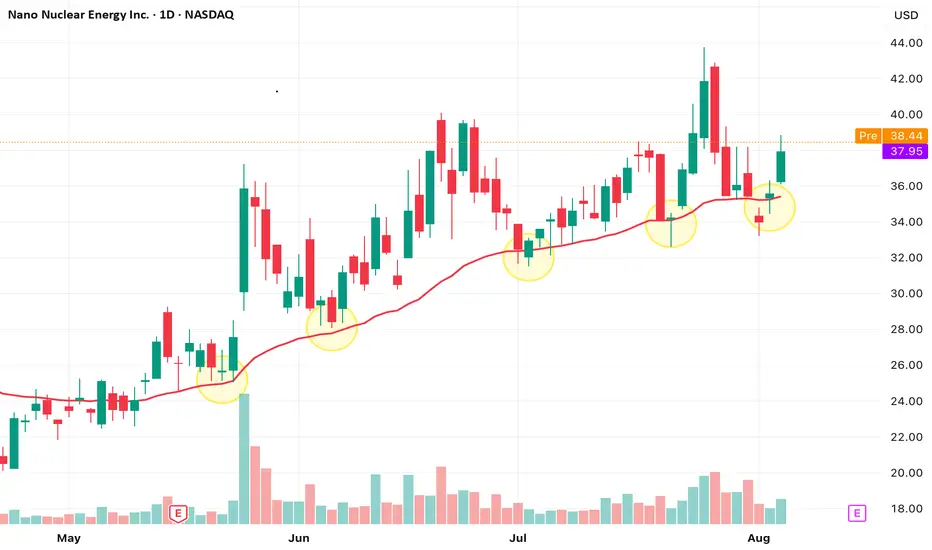
NASDAQ: NNE - Bouncing Off the Strong EMA 30?Nano Nuclear Energy - Price is retesting the EMA 30 after a sharp rally—will it hold as dynamic support and fuel the next leg up?
Uptrend
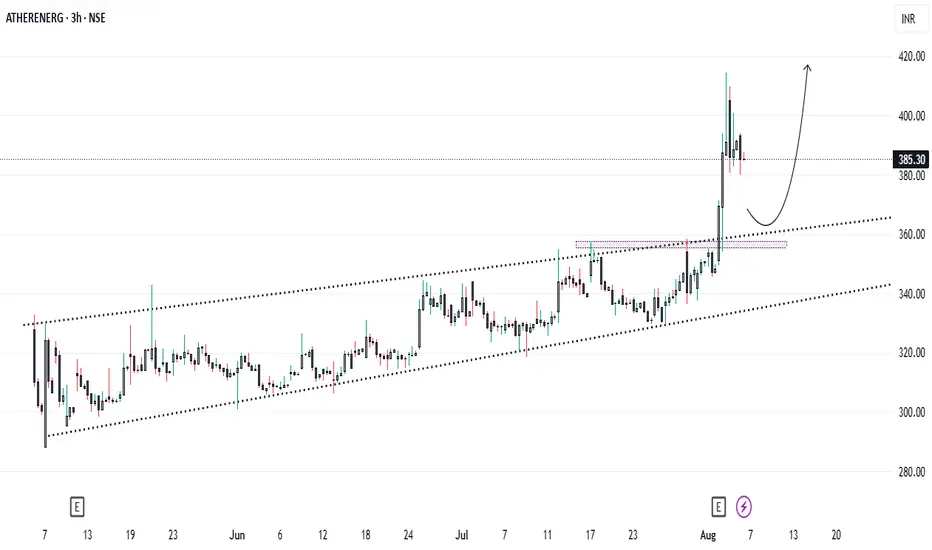
Ather Energy Breaks Out! What's Fueling the 13% Surge..?Since its stock market debut, Ather Energy had been gliding within a smooth upward channel until something major shifted this week. On the back of stellar Q1 FY26 results, the stock did something bold:
✅ Broke the channel
✅ Shot up 13% in a single day
✅ Hit a fresh 52-week high near ₹394
So, what’s driving this electric rally? And more importantly, what’s the next smart move for investors ?
🔍 Q1 Results: Narrower Loss, Explosive Growth
On August 4, 2025, Ather Energy dropped its first earnings report post-listing, and the numbers turned heads:
* 📉 Net loss trimmed to ₹178.2 crore (vs. ₹182.9 crore YoY)
* 🚀 Revenue surged 79% YoY to ₹645 crore
* 🔋 Vehicle sales jumped 97% YoY to 46,078 units
* 🛵 Family scooter “Rizta” became a hit, now 60% of total sales!
Management also highlighted better cost control, improved operating efficiency, and a margin boost of nearly 1,700 basis points YoY — a sign the business is scaling fast without burning as much cash.
📈 Chart Talk: Breakout Confirmed, Entry at ₹357 ?
Technically speaking, Ather had been moving in a classic ascending channel since its listing. But the Q1 numbers triggered a powerful breakout:
* ✅ Channel resistance broken
* ✅ Huge bullish volume
* ✅ Momentum carried the stock to ₹394 intraday
Now, for those waiting on the sidelines, the ideal entry opportunity could come around ₹357, where:
* The previous resistance could act as new support
* It aligns with 38–50% Fibonacci retracement
* A healthy pullback may offer a low-risk, high-reward setup
📊 Analyst View & Expansion Strategy
* 🏬 **95 new experience centers opened in Q1
* 🌍 Market share expanded to 14% pan-India, 22% in South India
* 🏦 HSBC initiated coverage with a ‘Buy’ rating and ₹450 target
Even amidst tough EV competition (Ola Electric, TVS, Bajaj), Ather is building a tech-driven moat with strong brand equity, energy-efficient performance, and now promising financials.
⚠️ What to Watch Out For
* 🔧 A temporary rare-earth supply disruption due to China’s export policy — management says risk is under control.
* 🧾 Still **not profitable, so long-term earnings trajectory needs close tracking.
* 🔋 EV sector competition remains fierce; execution will be key.
📌 Final Word: Wait for the Dip ?
Ather’s breakout is backed by both strong fundamentals and a bullish technical setup. If the stock pulls back to the ₹357 zone, it could present an excellent opportunity for those who missed the initial run.
📍Plan:
* ✅ Add to watchlist
* 🔁 Wait for pullback
* 🛑 Stop-loss below ₹340 (if entering at ₹357)
* 🎯 Short-term targets: ₹394 (previous high), ₹420+, ₹450 (HSBC target)
Ather is charging ahead. Are you ready to plug in ?⚡
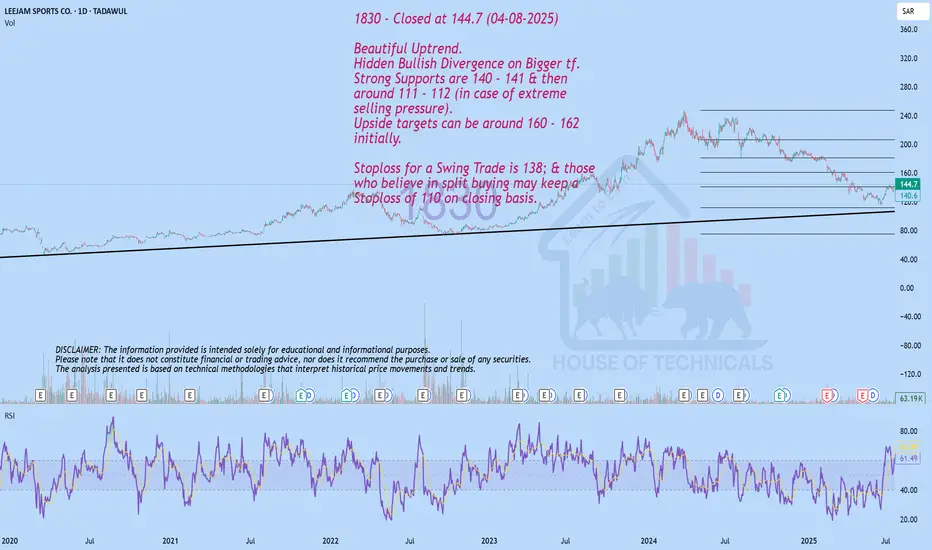
Beautiful Uptrend.1830 - Closed at 144.7 (04-08-2025)
Beautiful Uptrend.
Hidden Bullish Divergence on Bigger tf.
Strong Supports are 140 - 141 & then
around 111 - 112 (in case of extreme
selling pressure).
Upside targets can be around 160 - 162
initially.
Stoploss for a Swing Trade is 138; & those
who believe in split buying may keep a
Stoploss of 110 on closing basis.
USOIL GROWTH AHEAD|
✅CRUDE OIL broke the key
Structure level of 69.50$
While trading in an local uptrend
Which makes me bullish biased
And I think that after the retest of the broken level is complete
A rebound and bullish continuation will follow
LONG🚀
✅Like and subscribe to never miss a new idea!✅
Disclosure: I am part of Trade Nation's Influencer program and receive a monthly fee for using their TradingView charts in my analysis.

DeFi’s Make-or-Break MomentThe spotlight today is on TOTALDEFI, an index that could become one of the most exciting charts in the crypto market.
While many altcoins look heavy under selling pressure, TOTALDEFI is holding firmly at the 61.8% Fibonacci support near 116B. This zone is often a turning point where strong reversals begin. If the level continues to hold, we might see a 20% move to the upside, signaling renewed strength in the DeFi sector.
This price action could be a sign that decentralized finance projects are ready to lead the next market phase.

NAS100 Bigger Picture. Uptrend to be resumedLooking at the current structure through the lens of a trend trading approach, what we saw on NAS100 is more than a simple price bounce, it’s a trend continuation trading within a high-volatility environment. As price is approaching a key resistance level, how price is behaving around this dynamic trendline will be key.
This recent retracement and rejection happening near what we can call a demand zone cluster, was confirmed by a beautiful bounce off the support range. And right now price is respecting the upper and lower bounds nicely.
What happens next? Price is showing signs of bullish exhaustion, but the higher-timeframe structure supports a continuation.
My projected target is towards the upper resistance line, that’s my 23,100 zone as shown.

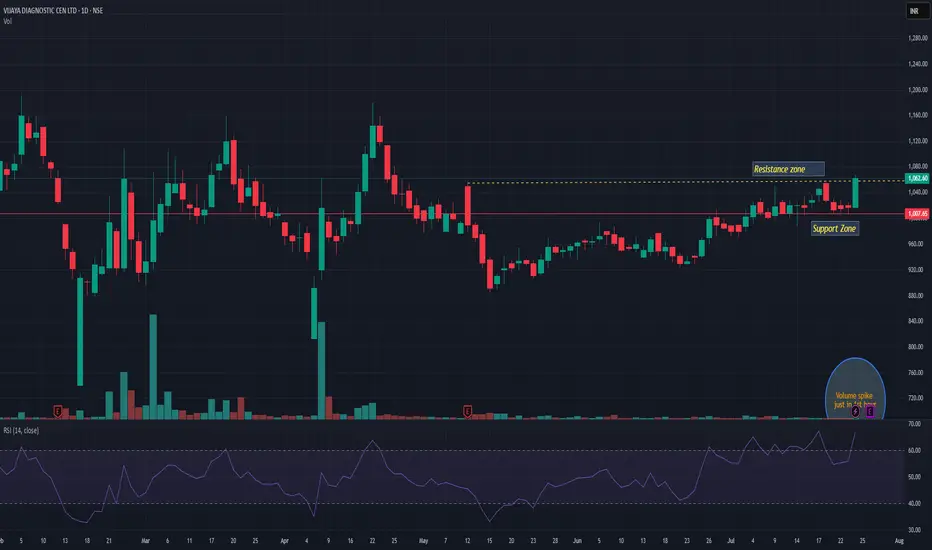
VIJAYAVIJAYA giving trendline breakout with decent volume. Q1 result is on 28th July may push momentum rally. Support seems near 1005 level. We may see momentum up to 1170 in coming days. Keep it on radar.
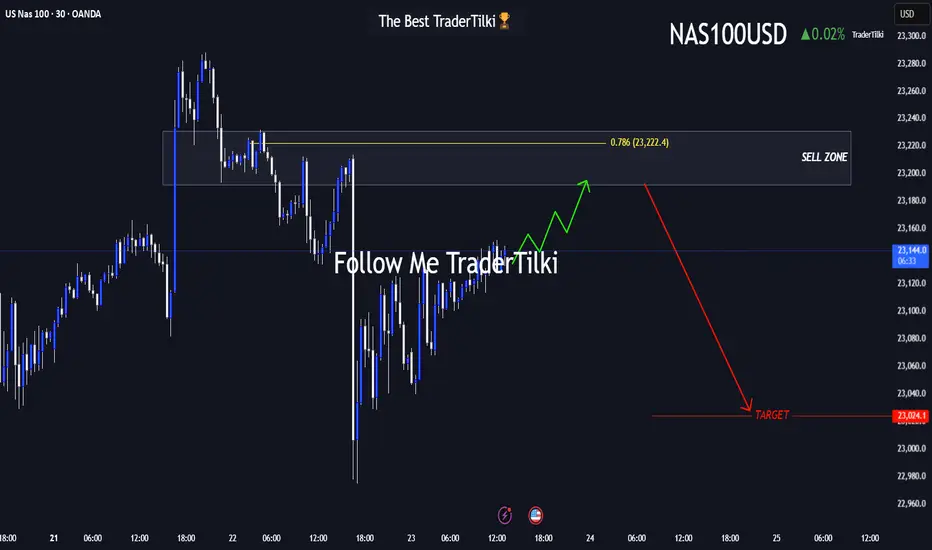
The US100-Nasdaq Playbook: Prime Sell Zone Approaching!Hey friends 👋
I’ve prepared a fresh US100-NASDAQ analysis for you all. Nothing makes me happier than seeing us grow and profit together.
📌 Once price reaches the 23,192 – 23,231 zone, I plan to enter a **Sell** trade from that area.
🔐 Feel free to set your stop-loss based on your personal margin and risk tolerance.
🎯 My target level is: **23,024**
Every single like from you means the world to me—it’s my biggest motivation to keep sharing high-quality analysis 🙏
Huge thanks to everyone who supports with their likes 💙
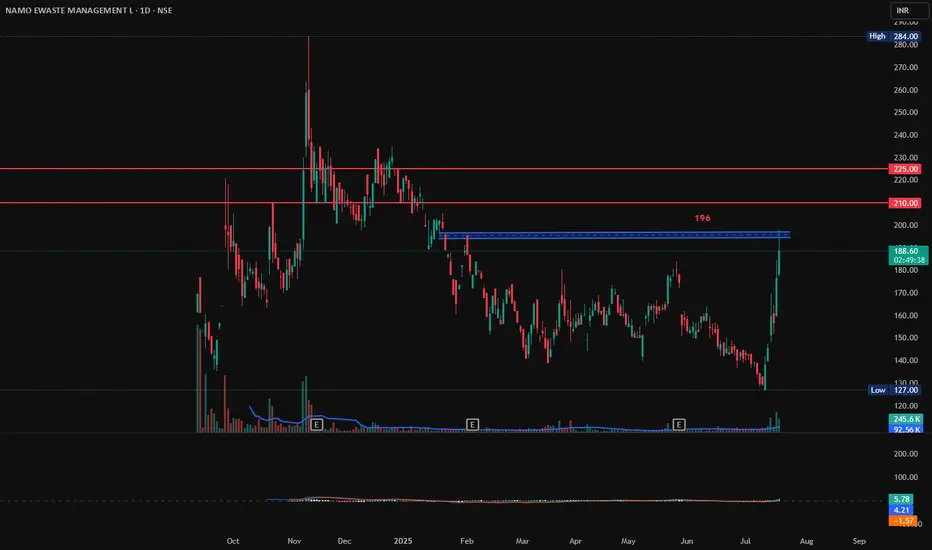
NAMO EWASTE MANAGEMENT, Long, Breakout, 1DNAMO EWASTE MANAGEMENT has gain 6% today with good volumes. If it breaks and sustains 196 with Bullish candlestick patterns like Bullish Engulfing, Hammer & Inverted Hammer, Piercing Line, Morning Star, Three White Soldiers, Tweezer Bottoms or Bullish Harami, then there are good chances for it to go further up from here. First target will be 210 and second target 225.
Entry: 196 (on Bullish candlestick pattern)
Target1: 210
Target2: 225.
SL: 185
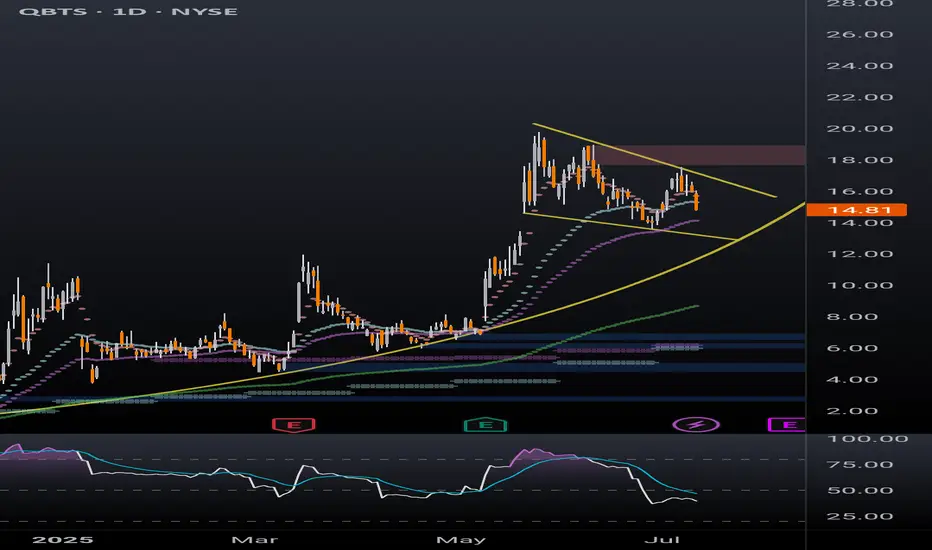
QBTS bull flag dailyBetter look at quantum computing ticker QBTS bull flag on the daily timeframe. Previous post looked at the weekly timeframe to highlight the bullish momentum. Lots of retail money piled into this one in the last few months, a breakout of this bull flag will likely be followed by a parabolic move.
EURAUD, Trend continuationPrice has made a correction and pulled back into the trendline, a continuation of the uptrend is the next.

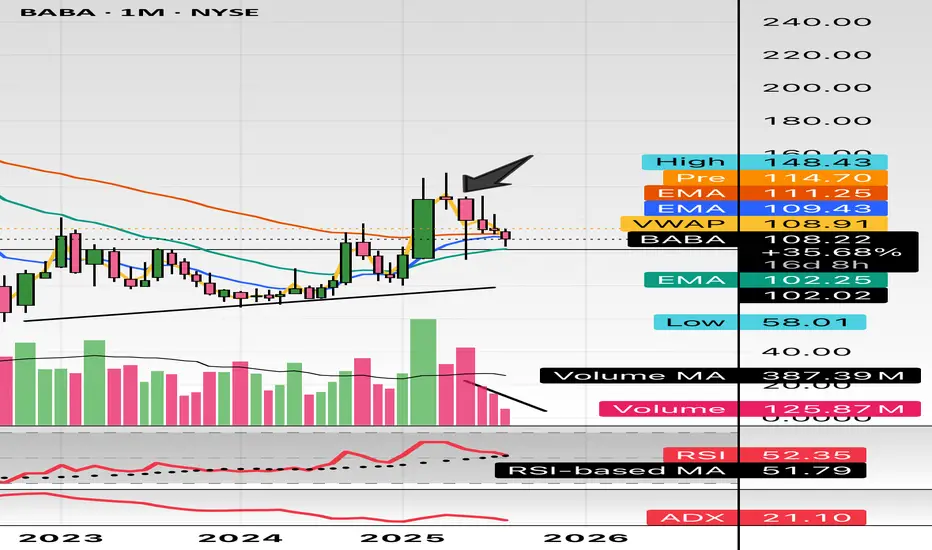
$BABA don’t miss this milky bottle. Called this out at $105 in minds. This Monthly declining volume, support at $100, and uptrend pattern. China will boom into the end of Q3 and early 2026. Target is $180 and $200.
WSL.
GOLD Local Rebound Ahead! Buy!
Hello,Traders!
GOLD made a retest of
The horizontal support
Level of 3343$ and as
We are locally bullish
Biases we will be expecting
A local bullish rebound
Buy!
Comment and subscribe to help us grow!
Check out other forecasts below too!
Disclosure: I am part of Trade Nation's Influencer program and receive a monthly fee for using their TradingView charts in my analysis.

GOLD SWING LONG|
✅GOLD is trading in a strong
Long-term uptrend along the
Rising support line so we are
Bullish biased and after the price
Breakout of the local opening wedge
We we will be expecting a
Further bullish move up
LONG🚀
✅Like and subscribe to never miss a new idea!✅
Disclosure: I am part of Trade Nation's Influencer program and receive a monthly fee for using their TradingView charts in my analysis.

BTC Bulls, this one is for you ;)As most of you know, I’ve been bullish on Bitcoin for quite a while now. And today, I want to show you exactly which resistance levels I’m watching if the breakout continues.
On the weekly BTC/USDT chart, I’ve marked out five key upside targets, all based on Fibonacci extension levels — not just random lines, but technical zones that often attract serious reaction from the market.
Let’s break them down:
🔸 Target 1 — $124K
This lines up with the 141.4% Fibonacci extension and also happens to match the projected move of a textbook Cup & Handle pattern. It’s the first big checkpoint.
🔸 Target 2 — $137K
Here we’ve got the 227.2% Fib level — a classic continuation zone if momentum remains strong.
🔸 Target 3 — $145K
Next up is the 241.4% extension, where we could see some heavier resistance and price interaction.
🔸 Target 4 — $155K
One of the strongest zones on the map. Why? Because it merges four separate Fibonacci extensions in one cluster. A real decision point.
🔸 Target 5 — $167K
And the final target (for now) — the 261.8% extension. If BTC gets here, it’ll be a major event.
🎯 My View:
This isn’t hopium. These levels are based on market structure, Fibonacci math, and historical behavior. As always, I’ll adjust based on price action, but these are the areas I’m preparing for.

DRBHCOM - The LOW is getting HIGHER !DRBHCOM - CURRENT PRICE : RM0.815
The stock made a HIGHER LOW recently - this may consider as a half portion of new uptrend is completed. A breakout above RM0.930 will form the higher high structure - which confirm the new uptrend phase.
For short term trading purposes, short term traders may anticipate to buy if the stock breakout nearest resistance of RM0.830 - which will give an entry point at RM0.835. So this is a pending breakout stock. Nearest target will be RM0.870 and RM0.910. While support will be RM0.795. Take note also that MACD give a bullish hint.
ENTRY PRICE : RM0.835
TARGET : RM0.870 and RM0.910
SUPPORT : RM0.795
Notes : If the stock breakout RM0.930 in the future, it is a sign of strong bullish momentum (strong uptrend). So at that particular time, trend follower traders may anticipate to buy at RM0.935 - RM0.940.

AMAZON Will Keep Growing! Buy!
Hello,Traders!
AMAZON is trading in an
Uptrend and the stock made
A breakout and retest of the
Key horizontal support
Of 218$ and is going up again
So we are bullish biased
And we will be expecting
A further bullish move up
Buy!
Comment and subscribe to help us grow!
Check out other forecasts below too!
Disclosure: I am part of Trade Nation's Influencer program and receive a monthly fee for using their TradingView charts in my analysis.

$SNAP -- accumulation $8 into $9. big move brewing into earningsHello, extensive chart here: Daily and Weekly. Looking at this name I like the setup here. The Daily and Weekly chart shows strength in this area, $8 to $9 with heavy accumulation and support. The Weekly chart shows about 13 weeks of this bottoming area with tons of buying from previous years as well. NYSE:SNAP has earnings July 25th and I will be looking to enter $10 calls with a date of 8/15. The premiums could spike just into earnings since it is a popular name to play around that time and it has plenty of daily volume. The SMA and EMA on the weekly honestly is my target -- it is a big sell zone. We are in the liquidity area and have been. Will be starting a position on these contracts this coming week. This name should see $10 with relative strength but my first target is mid $12 before earnings. I would like to shed some contracts into the earnings date and see if we can make an extra buck or two on profited contracts so when earnings comes it can be a risk free stress free play.
WSL.

EUR-JPY Will Keep Growing! Buy!
Hello,Traders!
EUR-JPY is trading in an
Uptrend and the pair broke
The key horizontal level
Of 169.814 and the breakout
Is confirmed so after a potential
Retest of the support cluster
Of the rising and horizontal
Support lines below we will
Be expecting a bullish continuation
Buy!
Comment and subscribe to help us grow!
Check out other forecasts below too!
Disclosure: I am part of Trade Nation's Influencer program and receive a monthly fee for using their TradingView charts in my analysis.

AUD-USD Very Strong Uptrend! Buy!
Hello,Traders!
AUD-USD is trading in a
Very strong uptrend and
The pair broke a key horizontal
Level around 0.6540 which
Is now a support and we
Are already seeing a rebound
So we are bullish biased
And we will be expecting
A further move up
Buy!
Comment and subscribe to help us grow!
Check out other forecasts below too!
Disclosure: I am part of Trade Nation's Influencer program and receive a monthly fee for using their TradingView charts in my analysis.

Sideways ChannelLooks like today we have bounced off the midpoint of this channel. Yesterday we dropped, today we rise!
Overall, this looks like a very neutral position. Potential for a short gain here up to previous highs with a bounce back down to lows.
No one can predict how long we will stay in this channel, but the breakout or breakdown will be very bold and very loud in one direction.
As a trend trader, I am looking to a breakup potential right now. If I had to be in a position, it would be long.

EURUSD – 2 Potential Intraday Setups (5-Min Chart)Chart Overview:
This 5-min EURUSD chart shows two example trade setups aligned with the main uptrend. These are shared purely for learning how to recognize and plan structured entries.
(Details are being shown in m5 chart- if this in not working for you please follow to be able to see it- as it is a private idea)
🔹 Example Trade 1 – 3rd Touch of Triangle Support
✅ Context:
Price retested the lower boundary of a broad triangle/wedge for the third time—often a strong area for reactive buys in an uptrend.
✅ Plan Concept:
Entry: Reversal signal on the 3rd touch.
Stop: Below the signal bar low.
Target: Mid to upper wedge area (or TP2).
🔹 Example Trade 2 – Breakout of Descending Flag
✅ Context:
After bouncing off trendline support, price formed a descending flag consolidation.
✅ Plan Concept:
Entry: Break and close above flag resistance.
Stop: Below the strong breakout candle.
Target: Extension toward recent highs (or TP2).
💡 Important:
These examples are not signals and not executed trades—they illustrate a possible planning process for traders studying price action strategies.
💡 Why These Matter:
Both setups align with the primary uptrend, use clear structure for risk placement, and rely on confirmation before entry.
🔹 Note:
These are educational examples only, not trade signals.
💬 Do you study similar setups? Share your charts and thoughts!
Thanks for your attention and your time...
Follow for more setups
#EURUSD #Forex #TradingEducation #PriceAction #IntradayTrading #BreakoutTrading #TechnicalAnalysis #LearnTrading #TradingView

US100 BULLISH BREAKOUT|LONG|
✅US100 is going up
Now and the index made a bullish
Breakout of the key horizontal
Level of 22,222 and the breakout
Is confirmed so we are bullish
Biased and we will be expecting
A further bullish move up
LONG🚀
✅Like and subscribe to never miss a new idea!✅
Disclosure: I am part of Trade Nation's Influencer program and receive a monthly fee for using their TradingView charts in my analysis.
