GAS vs Bitcoin Getting TractionGAS has found the support at btc 0.0024, that is 76.4% Fibonacci retracement level. This support has been rejected twice, along with the uptrend trendline. The wave up followed, where GAS/BTC broke above the downtrend trendline suggesting the beginning of the uptrend.
Nearest upside resistance is seen at 38.2% Fibonacci, that is btc 0.0038. Previously this level has been acting as the support and then resistance, therefore it is reasonable to expect some resistance again.
While the price continues to print higher highs and higher lows, the downtrend seems to be unlikely at this point. Only break and close below the btc 0.002 could invalidate bullish outlook and establish the downtrend.
Uptrend-buy

Lunyr VS Bitcoin Upside TargetsAfter Lunyr has reached the btc 0.0038 high on the 14th of May, price went sharply down and broke below the uptrend trendline. Fibonacci applied to the corrective wave up after the trendline break, shows that support was found at 227.2% level, that is btc 0.00145.
The support has been rejected cleanly and price starting to move up. This tendency is likely to continue, while the price should reached one of the targets/ resistance levels. First resistance eis at btc 0.00188, that corresponds with the previous resistance as well as the uptrend and downtrend trendline. When/if that level is broken the next target is at btc 0.0023, that is 38.2% Fibs.
The downtrend could continue only in case the support level is broken, which at this point seems to be unlikely. However, break and close below the btc 0.00145 should invalidate bullish outlook, where the downtrend might continue.

Aelf VS Bitcoin Uptrend AccelerationFollowing the previous idea on Aelf , it has reached and broke above the upside target suggesting the continuation and perhaps acceleration of the uptrend. ELF/BTC has gained 325% since March, while the price moved from 6k satoshis support up to 23.8k satoshis all-time high.
On a corrective wave down price corrected to 14.7k satoshis, that is 50% Fibonacci retracement level that has been rejected cleanly. At the same time ELF is very close to 50 Moving Average which could act as the support as it was on the 25th of April.
While Aelf is trading above 10k satoshis psychological support price is likely to continue moving higher providing a strong growth. Because the nearest resistance, the key resistance, is at 65k satoshis, that is confirmed by two Fibonacci retracement leveles, 727.2% and 361.8%.
Nevertheless the downside risk always remains, but only break and close below 10k satoshis psychological support could invalidate bullish outlook.

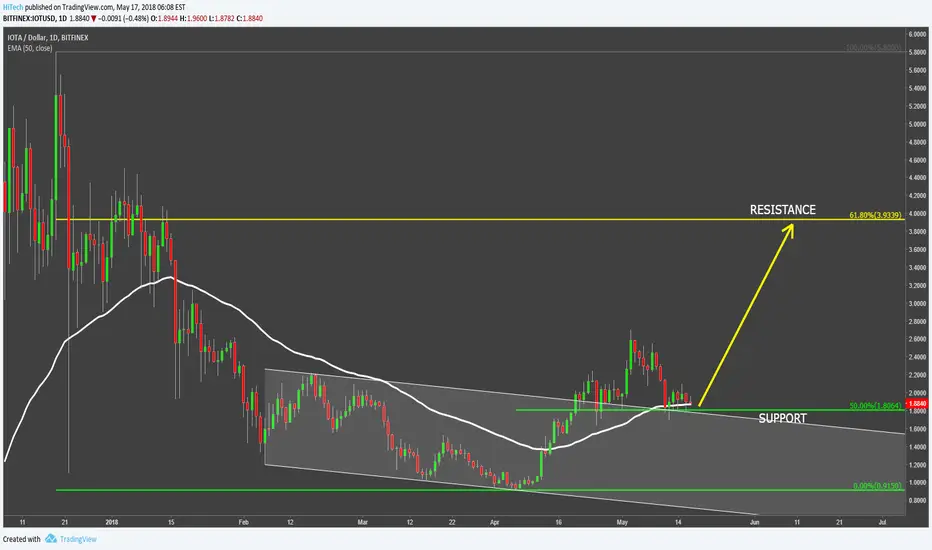
IOTA Has Over 100% Upside PotentialIOTA formed a bottom near $1 psychological support and price started to move up. IOT/USD broke above the 50 Moving Average followed by the breakout of the descending channel. Price has reached the high at $2.7 and corrected down.
The support has been found at 50% Fibonacci retracement level that is $1.8. At the same time IOTA is rejecting the 50 Moving Average and the upper trendline of the descending channel. If current support will continue to hold, price is likely to move higher, where the next resistance is seen at 61.8% Fibonacci retracement, that is $4 area.
On a downside, daily close below $1.7 is required in order to invalidate bullish outlook. In this case IOTA might go down, towards previous support area at $1
Incent VS Bitcoin Ready To GoAfter finding the support at 2400 satoshis, Incent has started to consistently move up, producing higher highs and higher lows. At the same time price is rejecting the uptrend trendline, 23.6% Fibonacci retracement and currently trading above the 200 Moving Average.
Seems that it is only a matter of time for INCNT/BTC to break above the previous resistance at 4940 satoshis and produce a new high. There are two major resistance levels to watch, first is 5700 satoshis that is 161.8% Fibs of the current corrective wave down. Second target is 261.8% Fibs, that corresponds to 88.6% at 7100 satoshis. Break above the second target could result in the beginning of a stronger growth and should potentially send price much higher.
However, on a downside, break and close below 3660 satoshis support should invalidate bullish outlook and downtrend could start to dominate.

TimeNewBank VS Bitcoin is About to Blow Up?TimeNewBank token had a massive correction down after reaching an all-time high at 2255 satoshis. Price declined by 86% and found the support only at 300 satoshis area. This is the 261.8% Fibonacci retracement level, applied to the corrective wave after the uptrend trendline breakout. The support is being rejected, and during the period of two months price failed to go any lower.
While staying above the support level, TNB/BTC could have formed a strong bottom, which might result in a trend reversal. The first target is at 720 satoshis, and second is at 1250 satoshis, both correspond to the Fibonacci retracement levels and previous levels of the support/resistance.
On a downside, break and close below 250 satoshis should invalidate short-term bullish outlook and extend the consolidation. No major decline can be expected since TNB current price is already extremely low and trading at 360 satoshis.

NEM is Now Listed on BinanceJust a few hours ago NEM coin has been added to Binance and XEM/BNB, XEM/BTC, and XEM/ETH trading pairs are now available for trading. This news certainly can add trading volume for this coin and potentially boost the upside momentum that seems already started.
After a strong correction for the 13.5k satoshis high, currently, XEM/BTC is trading at 3750 satoshis, which could seem an attractive and cheap price for investors. Technically, XEM/BTC trend remains upwards as the 227.2% Fibonacci channel trendline has been broken on a daily chart. The two Fibs applied to the corrective waves after the downtrend trendline breakout point to the 21k satoshis as an upside target, which is almost 500% potential gain. While NEM is trading above 2440 satoshis support the uptrend is likely to begin.
However, break and close below the support could send price back to 800 satoshis and/or extend the consolidation period prior to the uptrend.

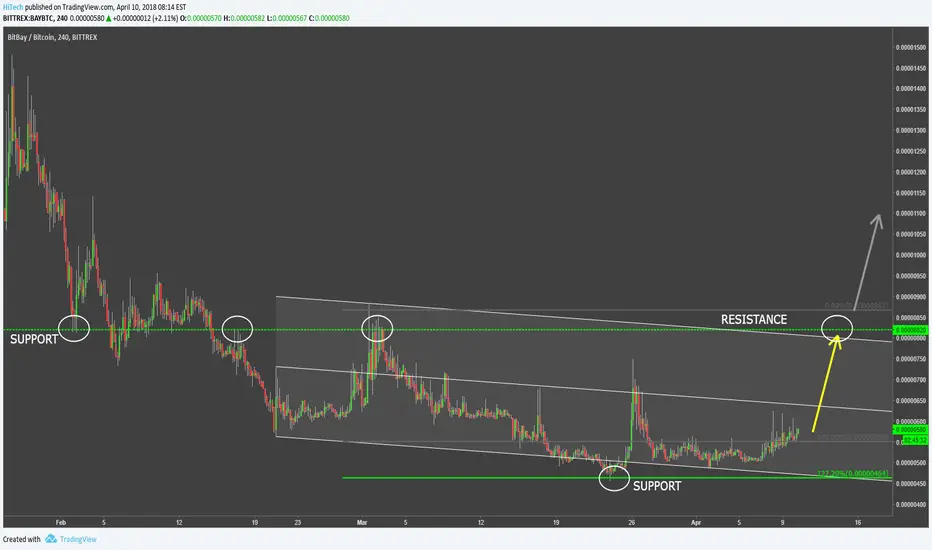
BitBay VS Bitcoin Upcoming WaveBitBay has found the support at 464 satoshis, that is 127.2% Fibonacci applied to the corrective wave up after the 820 satoshi support breakout. The Fibonacci support has been rejected cleanly followed by a strong wave upwards.
The correction down followed along with the consolidation, where BAY/BTC has been trading around 500 satoshis nearly two weeks. But now volume in increasing once again and BitBay could be ready to go up.
The strong resistance is obviously at 820 satoshis and this could be the very fist upside target. Break and close above it should confirm long term uptrend.
QuantumStamp VS Bitcoin Upcoming ReversalQuantumStamp topped at 5422 satoshis, after which the correction down begun. Price broke the uptrend trendline and went further down, where it found the support at 1700 satoshis.
At 1700 satoshis, the 76.4% Fibonacci has been rejected cleanly, as well as 327.2% Fibs applied to the corrective wave up after the uptrend trendline breakout. At the bottom, RSI oscillator formed a bullish divergence, followed by the break above the downtrend trendline.
Such price action suggests the end of correction and potential continuation of a long-term uptrend.

Florincoin VS Bitcoin - The End Of Consolidation?Since Florincoin reached the high at 6.5k satoshis, back in May 2017, the price has been going down, reaching the 500 satoshis low. This decline resulted in over 90% loss to bitcoin, but now price action begins to look in favor of the trend reversal.
After reaching 500 satoshis low, FLO/BTC went up breaking above two descending channels as well as the 200 Moving Average, although rejected the resistance formed around 3k satoshis area.
Currently, RSI has formed a bullish divergence suggesting that the price once again is ready to move higher, at least towards the massive resistance area at 3k satoshis. But to confirm the potential upcoming wave up, Florincoin should break above the minor resistance at 1200 satoshis. Break above the 3k satoshis resistance should result in more growth and could send price up to 6.5k satoshis or higher.


OmiseGo Trend Is UPAfter reaching the all-time high at $29, OmiseGo corrected down to 76.4% Fibonacci retracement level that has been rejected cleanly, together with the uptrend trendline. The uptrend remains valid and the price continues to print higher highs and higher lows on the Daily timeframe.
After rejecting the Fibonacci support OMG/USD once again started to produce higher highs and higher lows, confirming the uptrend on the lower timeframe. Currently, the short-term consolidation could take place, while OmiseGo remains bullish.
The nearest upside target is seen at $35, that is 75% growth potential from the current price. If OMG will correct down, a good buying opportunity should present itself around $17 level. In the worst case scenario price could correct back down to $7 or $11 support levels and only then continue the uptrend.

ViaCoin VS Bitcoin Right At The SupportViaCoin finally managed to break above the descending channel signaling the potential beginning of a strong growth. VIA/BTC continues to trade above the 200 Moving Average while producing higher highs and higher lows.
After hitting a 5 month high at 53k satoshi, it corrected down where it rejected the upper trendline of the descending channel. From this point, the uptrend should resume sending the price up to 116k satoshi. At this price strong resistance can be found, confirmed with two retracement levels, 827.2% Fibs applied to the corrective wave after the channel breakout, and 141.4% Fibs applied to the corrective wave down started back in June 2017. Only break and close below 25k satoshi support could invalidate bullish outlook.

Lisk Up To $50?Lisk uptrend remains intact as it continues to produce higher highs and higher lows. The previous low was at $10.7 where 4/1 Gann Fan trendline was first rejected and currently this remains a key support area for Lisk.
On the 7th of January Lisk produced a new all-time high reaching $40 and then corrected down sharply where it tested and rejected the Gann Fan trendline and the 200 Moving Average. There are now few scenarios that can take place, first is Lisk will continue moving higher from the current price. Second is Lisk will correct back to the $18.8 and then will resume the uptrend. And third is Lisk will go lower to test $10 support, consolidate and only then will be on its' way to a new all-time high.
On the downside, daily break and close below $10 could invalidate bullish outlook and extend the consolidation period, but in any case, long term trend seems to be very bullish, and it's just a matter of time for Lisk to go up again.

Ionomy Might Grow 10 TimesFollowing the previous idea on Ionomy , it has reached the upside target at $3 and broke above it, reaching the $5 high. Then price corrected sharply down to the previous resistance at $2, which now is acting as a support. At the same time, ION/USD is testing the uptrend trendline and the 200 Moving Average.
This is indeed a very strong support for Ionomy which could result in rejection and the continuation of the uptrend. If support will be rejected, the next wave up could reach the previous high at $5. Breaking above that resistance would accelerate Ionomy growth and send the price up to $12 resistance, confirmed by two Fibonacci retracement levels.

CUP & HANDLE BUYING OPPORTUNITY [potential]a cup and handle formation may be brewing and if all goes as planned, this may be the beginning of a very steep and fast upshot.
buying opportunity but keep a close selling limit in case this bad boy decides to go the other way.

Ark VS Bitcoin RisingArk found the support at 18k satoshi and started to moving higher while breaking above the 200 Moving Average as well as the descending channel. After the breakout price corrected back and first rejected the Moving Average and then the upper trendline of the descending channel, both of which this time acted as a support.
With such price action, the uptrend scenario becomes more and more likely where ARK/BTC could rise up to 100k satoshi psychological resistance levels. This level is also confirmed by technical analysis, where two Fibonacci retracement levels are inline with each other. the 76.4% and 327.2% levels. Only a break and close below the Moving Average could invalidate bullish outlook.

Komodo Uptrend To ContinueFollowing the previous idea on Komodo , it has reached the upside target at $7 and broke higher reaching the $14.4 high. The corrective wave down followed while price rejected the support 727.2% Fibonacci, that is $7.1.
Currently, it seems that the uptrend is likely to continue to test next Fibonacci resistance level at $1727.2% retracement level, that is $14.7. While the support is holding, uptrend should remain valid pushing Komodo to new all-time highs. Break and close below could invalidate bullish outlook.

MONA - Short $11.50 - 16.00+ - Great buy pointsIf we bull our way past ~$15.00 (more importantly, 0.00097 satoshi), we should see a MASSIVE price change in the positive for MONA.
Bollingers are tightening up, indicating a stable price range has been closed upon.
OBV is high, but has been stable for nearly 2 months and historically that means a positive move for MONA.
RSI has clearly penetrated the 14 day RSI MA and stayed above in a parallel fashion.
MACD is above the signal line, but again in a parallel fashion and only above the line by a marginal amount.
So long as BTC doesn't hit 17.5k today, MONA should see a massive pump in the next 3-10 days.
My buy points & amounts are as follows:
0.00084 - 50 MONA
0.00077 - 200 MONA
0.00070 - 300+ MONA
Good luck, and as always, be safe with your trades. Bet what YOU want to bet, but understand what Risk vs. Reward is.
Cheers,
-Jordan
P.S. Please comment, agree, or share this if you found it useful. Feel free to leave me direct messages or say something in here if you have questions, or suggestions on my presentation of this technical analysis. Your feedback is tremendously helpful!

DASH/BTC 10/25/2017WITH THIS CONTENT CRYPTOCURRENCY CAPITAL LLC OR ITS AFFILIATES DO NOT PROVIDE INVESTMENT, TAX, LEGAL OR ACCOUNTING ADVICE. THIS MATERIAL HAS BEEN PREPARED FOR INFORMATIONAL PURPOSES ONLY AND IS NOT INTENDED TO PROVIDE, AND SHOULD NOT BE RELIED ON FOR, TAX, LEGAL, ACCOUNTING OR INVESTMENT ADVICE. YOU SHOULD CONSULT YOUR OWN INVESTMENT, TAX, LEGAL AND ACCOUNTING ADVISORS BEFORE ENGAGING IN ANY TRANSACTION AT YOUR OWN RISK.

1.15018 might be a resistance in the following hoursI think that a strong potential scenario for the EURCHF foreign exchange pair can be that the price encounters a resistance of 1.15018.

Ablynx: what a jumpAblynx' stock price jumps. Shorters are covering their positions in the U.S. Now a 14 level and a 15,50 are very close targets for now. I bought this option: ABY C12.50 18AUG17. Buy!

USDCAD Buy Signals Short-term and Long-termUSDCAD buy signal from 1.37.
Short-term trade:
Target is 1.382~ area
Long-term trade:
Target is 1.4 by Q2.
