INOX WIND BREAKOUT Target Levels
- Short-Term Target: 204–211.
- Medium-Term Target: 261–343
Stop-Loss Levels
- Short-Term Stop Loss: 184.2 near immediate support
- Medium-Term Stop Loss: 157.1–153.8 strong support zone
- Long-Term Stop Loss: 170.6 major trend support
Uptrend

Bajaj Hindusthan Sugar LtdBajaj Hindustan (Ethanol/Sugar Company)
if it sustain above 23 then I'm bullish in this for 1000% gain.
It'll going to give 13 years breakout.
Keep an eye on this.
NOTE: We are not SEBI registered. It's for knowledge purpose only. Consult to your financial adviser before take any trade.
MAY 27 , 2024
Note
entry trigged add half and more on weekly candle close above 23

MDLZ - Bullish Flag patternBullish Flag pattern
The Bull Flag pattern forecasts in the near future. Currently, it's just early planning with small profits and a reminder to set a stop loss if the pattern cannot breakout upwards.
Both the M50 and MACD indicators suggest the potential for price increase.
The volume is still low so it cannot break out yet.
The price now (Closed on 05.23.2025): $66.14
Price target: $70.11/ $74.64/ $84.60.
Stop loss: $63.43
IMO, amateur trader.

GBP-CAD Support Cluster! Buy!
Hello,Traders!
GBP-CAD is trading in a
Local uptrend along the
Rising support and the pair
Made a retest of the support
Cluster of the rising and
Horizontal support lines
Around 1.8546 from where
We are already seeing a
Bullish rebound so we
Will be expecting a
Further local bullish move
Up on Monday
Buy!
Comment and subscribe to help us grow!
Check out other forecasts below too!
Disclosure: I am part of Trade Nation's Influencer program and receive a monthly fee for using their TradingView charts in my analysis.

DAX WILL KEEP GROWING|LONG|
✅DAX made a retest of
The horizontal support level
Of 23,371 and the index is already
Making a bullish rebound so we
Are bullish biased and we will
Be expecting further growth on Monday
LONG🚀
✅Like and subscribe to never miss a new idea!✅
Disclosure: I am part of Trade Nation's Influencer program and receive a monthly fee for using their TradingView charts in my analysis.

DAX Long From Support! Buy!
Hello,Traders!
DAX is trading in an
Uptrend and the index
Is retesting the horizontal
Support level at 23,319
So we are bullish biased
And we will be expecting
A bullish rebound and
A move up next week
Buy!
Comment and subscribe to help us grow!
Check out other forecasts below too!
Disclosure: I am part of Trade Nation's Influencer program and receive a monthly fee for using their TradingView charts in my analysis.

BITCOIN Will Keep Growing! Buy!
Hello,Traders!
BITCOIN is trading in an
Uptrend and the coin made a
Great breakout of the previous
ATH which makes us super
Bullish biased so as BTC is
Making a local bearish correction
We will be expecting a bullish
Rebound from the rising support
And a further bullish move up
Buy!
Comment and subscribe to help us grow!
Check out other forecasts below too!
Disclosure: I am part of Trade Nation's Influencer program and receive a monthly fee for using their TradingView charts in my analysis.

Bitcoin Ready for new highAs we see BINANCE:BTCUSD break the previous high and made rounding bottom formation on chart.
So Looks like a bullish trend and if BINANCE:BTCUSD
sustain above 109000 then we can see BINANCE:BTCUSD
Up to around 133000.
Lets see!
This post is just my perception and for study purpose only.
As crypto market has high risk of loosing money. Please invest your hard earned money carefully.
I will not be responsible for any loss in the crypto market.

US30 May 21 If athletes get athlete's foot, what do elves get? Mistle-toes.
Now let's get to it. Before heading into the trade, I am definitely bullish. Price seems to be making a retracement before it pushes back up. I have given myself 3 potential entry points. But I am only going to enter them if:
Price makes market structure
Price breaks and retests through a key level/ entry point
If it bounces off of the trend line
Or a break of structure
And all of this, for me has to happen around 12pm est because I like to trade the afternoon session. But like a stallion price is going to do whatever it wants.
Stay safe and be patient
Amara Raja Energy & Mobility Limited Trend Reversal On ChartAmara Raja Energy & Mobility Limited, a flagship company of the group, is India’s largest manufacturer of automotive and industrial batteries. The company also produces Li-ion cells and battery packs for electric vehicles and the telecom industry.
At current price it looks very attractive for short term gains .
Short term target may show Up move to 1100 levels and initial support at 996
long term target intact 1700-1860 levels.

$3's to $7's catching easiest vertical part of the chart $SYTAGot to let the stock evolve properly, once enough of shortsellers are trapped inside they can only try to manipulate with crash attempts and when even those don't work out they're forced to cover (buy to exit their short position) into vertical push, and those amounts cannot be just clicked out in a second, it takes time to scale in and it takes time to scale out. The only problem is when it's in a bullish uptrend it gets faster and wilder.
Sent out Buy Alert for $3.80 buy expecting vertical and we got it! NASDAQ:SYTA

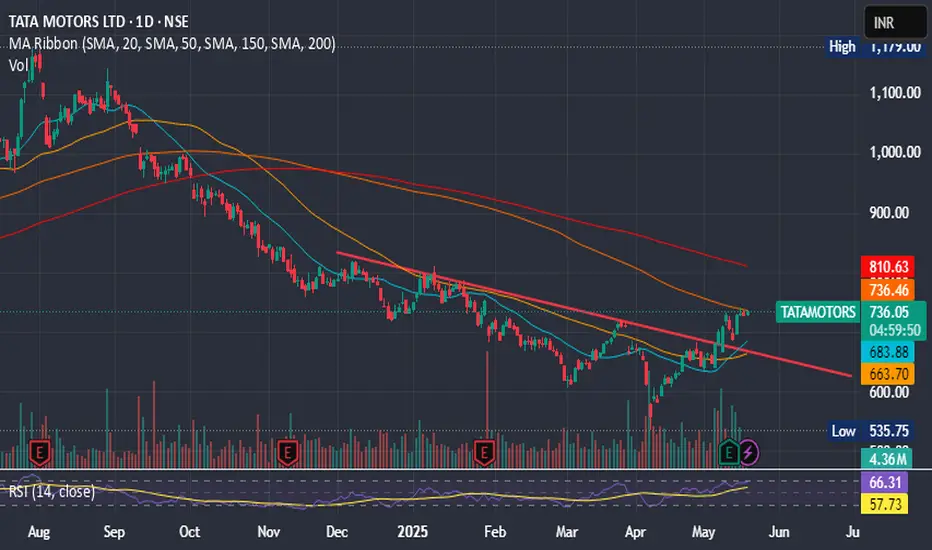
TATA MOTORS IGNITING MOMENTUM - Pivot Points: The classic pivot point is 731.45, with resistance levels at 733.4, 736.3, and 738.25, and support levels at 728.55, 726.6, and 723.7
Tata Motors' short-term trend appears bullish, with analysts predicting an upside target of ₹770–780 in the coming weeks. The stock has shown strong resilience near its support level of ₹715 and is trading above key short-term moving averages, signaling strength.
Key Levels:
- Support: 715–720
- Resistance: 735–740
- Target: 770–780 OR MORE TOWARDS 823
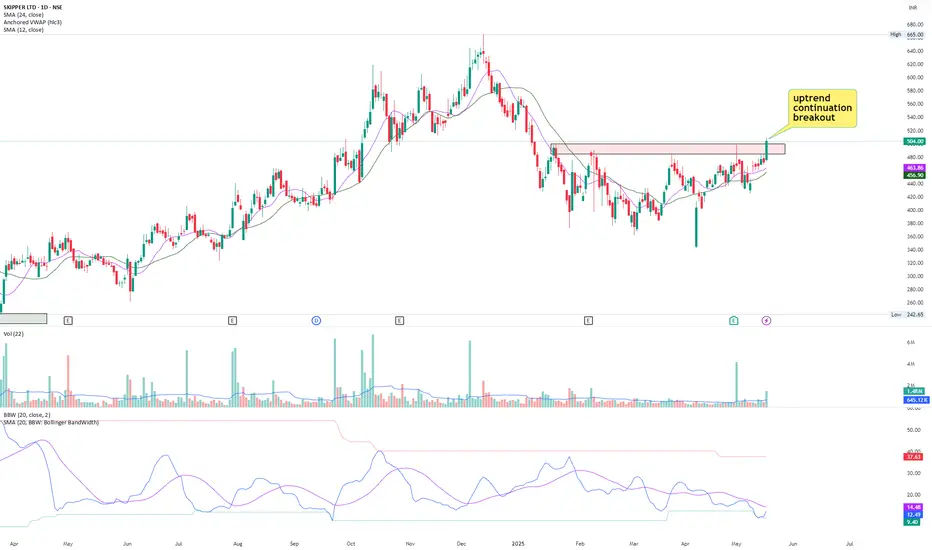
Breakout in SkipperStock has broken out of range of 4 months in long term uptrend with high relative volume.
Fundamentally, stock has delivered double digit earnings growth for straight 4 quarters.
Margins have also been increasing for last 3 quarters.
Overall, it's a good technofunda pick to watch out for.
DHANI SERVICES MAY GIVE BREAKOUT SOONDhani Services is an Indian consumer business that operates through its app, Dhani. It provides a range of services, including digital healthcare, financial services, e-commerce, UPI payments, stock trading, and bill payments. The company was originally founded as Indiabulls Ventures Limited in 1995 but was later renamed Dhani Services Limited in October 2020.
SHORT TERM MAY TOUCH 69 TO 72 MARK.

TATATECHKeep eye on TATATECH. If the price moves above 732, consider buying with a small SL.
Confirmation of the head and shoulders pattern occurs when the price breaks decisively below the neckline
Disclaimer:
This is not financial advice. Please do your own research or consult with a financial advisor before making any investment decisions. Investments in stocks can be risky and may result in loss of capital.

GBP_JPY GROWTH AHEAD|LONG|
✅GBP_JPY is going down now
But a strong support level is ahead
Thus I am expecting a rebound
And a move up towards the target above 194.000
LONG🚀
✅Like and subscribe to never miss a new idea!✅
Disclosure: I am part of Trade Nation's Influencer program and receive a monthly fee for using their TradingView charts in my analysis.

DAX Will Keep Growing! Buy!
Hello,Traders!
DAX broke the key horizontal
Level of 23,319 and the index
Made a pullback and retest
And is now going up again
So we are bullish biased
And we will be expecting
A further bullish move up
Buy!
Comment and subscribe to help us grow!
Check out other forecasts below too!
Disclosure: I am part of Trade Nation's Influencer program and receive a monthly fee for using their TradingView charts in my analysis.

GBP-JPY Long From Rising Support! Buy!
Hello,Traders!
GBP-JPY is trading along
The rising support line
And the pair will soon hit
A trend-line from where we
Will be expecting a local
Bullish rebound and a
Further bullish move up
Buy!
Comment and subscribe to help us grow!
Check out other forecasts below too!
Disclosure: I am part of Trade Nation's Influencer program and receive a monthly fee for using their TradingView charts in my analysis.

EUR_JPY LOCAL LONG|
✅EUR_JPY is trading in an uptrend
With the pair set to retest
The rising support line
From where I think the growth will continue
LONG🚀
✅Like and subscribe to never miss a new idea!✅
Disclosure: I am part of Trade Nation's Influencer program and receive a monthly fee for using their TradingView charts in my analysis.

Tata Power is showing strengthTata Power's technical indicators suggest a strong buy signal based on moving averages and oscillators. Here’s a quick breakdown:
- Relative Strength Index (RSI): 65.04 (indicating bullish momentum)
- MACD: 3.38 (positive crossover, signaling upward trend)
- Moving Averages: All major SMAs and EMAs indicate a buy
- Pivot Points: Key support at ₹388.64, resistance at ₹398.69
Close Above 400 mark will be positive
- Short-Term Forecast: Technical analysis suggests support around ₹390 and resistance near ₹626, with a potential price target of ₹417.23 in the next two weeks.

GME bullish with Golden crossGME bullish right now with:
- Golden cross in Day frame chart.
- Dragongly doji today maybe bullish if the volume higher tomorrow.
- MACD bullish .
- Pre Golden cross in Week frame chart too.
Today (05/15/2025) price closed: $28.63.
Entry now, R/R: 3.34.
Price target: $34.40.
Stop-loss: $26.90.
IMO.

DAX WILL KEEP GROWING|LONG|
✅DAX is trading in an uptrend
And the index made a bullish
Breakout of the key horizontal
Level of 23,400 and the breakout
Is confirmed so we are bullish
Biased and we will be expecting
A further bullish move up
LONG🚀
✅Like and subscribe to never miss a new idea!✅
Disclosure: I am part of Trade Nation's Influencer program and receive a monthly fee for using their TradingView charts in my analysis.

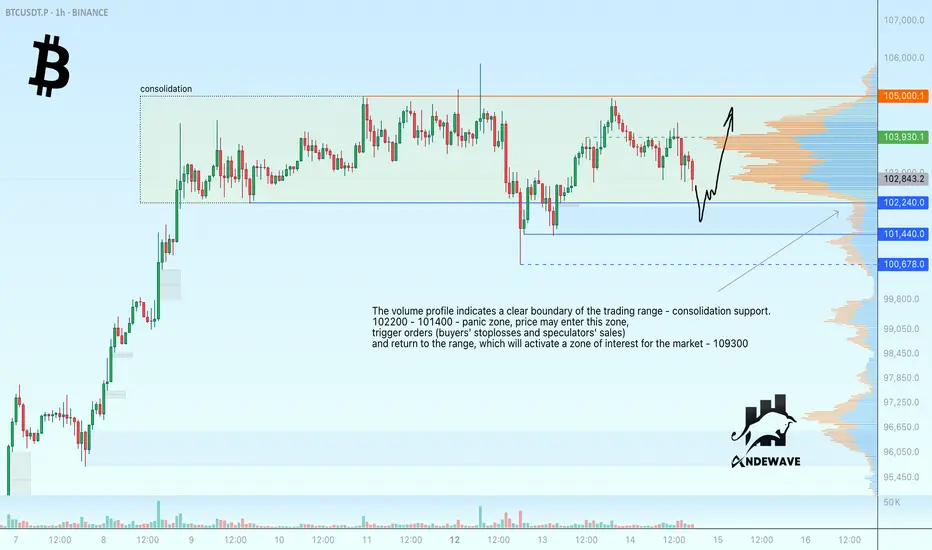
Bitcoin ready to test support before risingThe volume profile indicates a clear boundary of the trading range - consolidation support as a target for the current local movement.
102200 - 101400 - panic zone, price may enter this zone, provoke bids (buyers' stoplosses and speculators' sales) and return to the range, which will activate a zone of interest for the market - 103930.
Scenario: the price is trading inside the consolidation with clear boundaries - support and resistance. The price is aiming for the support within a bullish trend. False breakdown of support may trigger a rebound and growth. Target 103930 - 105000