✅DAX NEXT MOVE UP|LONG🚀
✅DAX is trading in an uptrend
And is still consolidating above
The horizontal support line of 15.600
But I am bullish biased so I think
That it will go up eventually
LONG🚀
✅Like and subscribe to never miss a new idea!✅
Uptrend

GBP-AUD Long From Support Cluster! Buy!
Hello,Traders!
GBP-AUD is trading in an
Uptrend along the rising
Support which confluences
With the horizontal support
Of 1.8644 and from where
I think we will see a move up
Buy!
Like, comment and subscribe to help us grow!
Check out other forecasts below too!

✅GBP_NZD WILL GO UP|LONG🚀
✅GBP_NZD is trading in an uptrend
And the bullish bias is confirmed
By the rebound we are seeing
After the pair retested the support
So I think the growth will continue
LONG🚀
✅Like and subscribe to never miss a new idea!✅

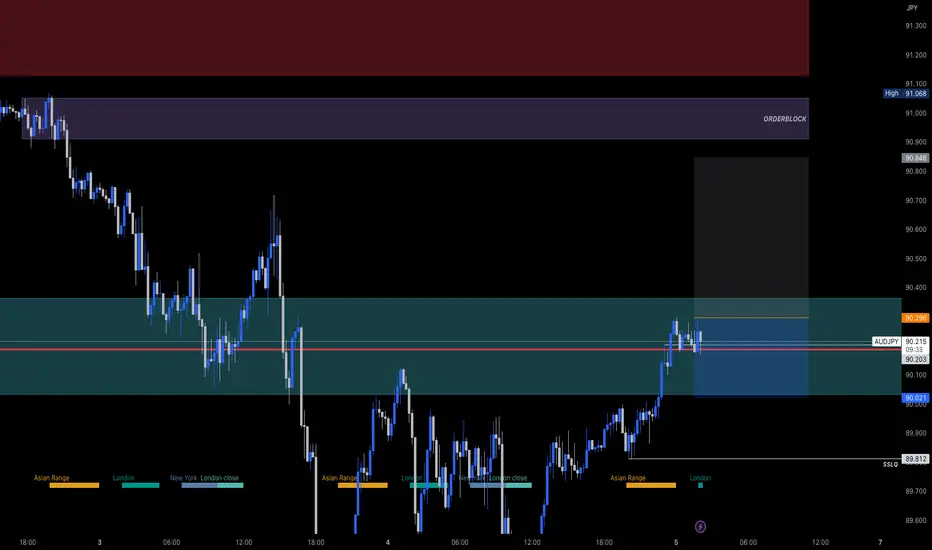
AUDJPY TRADE IDEA / DAY TRADE / LONGThis is trade idea for AUDJPY USD Day Trade
-Buy above 90.296 (BOS and Buyside Liquidity Asian Session) according to the confirmation that will occur.
-Possible bullish price movement towards the resistance.
-Risk Reward 1:2
GBPJPY TRADE IDEA / DAY TRADE / LONGThis is trade idea for GBPJPY USD Day Trade
-Buy above 169.040 (Buyside Liquidity Asian Session) according to the confirmation that will occur.
-Possible bullish price movement towards the resistance.
-Risk Reward 1:2

EURJPY TRADE IDEA / DAY TRADE / LONGThis is trade idea for EURJPY USD Day Trade
-Buy above 148.058 (BOS and Buyside Liquidity Asian Session) according to the confirmation that will occur.
-Possible bullish price movement towards the resistance.
-Risk Reward 1:2

USDJPY I Intraday long from supportWelcome back! Let me know your thoughts in the comments!
** USDJPY Analysis - Listen to video!
We recommend that you keep this pair on your watchlist and enter when the entry criteria of your strategy is met.
Please support this idea with a LIKE and COMMENT if you find it useful and Click "Follow" on our profile if you'd like these trade ideas delivered straight to your email in the future.
Thanks for your continued support!

GBPUSD TRADE IDEA / DAY TRADE / LONGThis is trade idea for GBPUSD Day Trade
-Buy above 1.25923 (Buyside Liquidity Asian Session) according to the confirmation that will occur.
-Possible bullish price movement towards the resistance.
-Risk Reward 1:2

✅USD_JPY WILL GO UP|LONG🚀
✅USD_JPY is trading in an
Uptrend along the rising support
And I am bullish biased
On the pair so I think it
Will go up and retest
The target of 136.00
LONG🚀
✅Like and subscribe to never miss a new idea!✅

GBP-NZD Growing Inside The Channel! Buy!
Hello,Traders!
GBP-NZD is trading in an
Uptrend in a rising channel
And the pair has retested
And rebounded successfully
From the rising support of the
Channel so further growth
Is to be expected
Buy!
Like, comment and subscribe to help us grow!
Check out other forecasts below too!

$AQUA with the trifecta: price, volume & relative strengthThe price has formed a head and shoulders pattern and now I'm waiting for the follow through above $50.
The OBV and the RS ratio vs the S&P 500 are near new highs confirming the strength in price action.
Still, I'll wait for the breakout to buy with a price target at HKEX:62 for a +25% profit.
You can see that I was stopped out on MARCH 2022, can you imagine if I hadn't use a stop loss? More than a year with dead money.
I good to see other leaders within the industry like NASDAQ:TAYD , NYSE:SXI , NYSE:GHM & NASDAQ:SYM are also trending higher, this gives support to $NYSE:AQUA.
This is a market of stocks, not a stock market!

GOLD | Bullish Sentiments | Long SetupThe current price of gold is in a phase of consolidation but attempting to break out of this range. The current price is being supported by a strong level of buying activity and forming a pattern of higher highs and higher lows, which may indicate a potential bullish trend.

PG Proctor & Gamble Swing Long or InvestPG had a triple bottom in March and now is again on an uptrend rest
march towards the all-time high of $ 165 which is the target here.
The volume indicator shows a slowly rising volume compared with March
with a spike on April 20th corresponding to a favorable earnings play.
The long term moving average shows the reversal of the downtrend
into a triple bottom ( long moving average with near zero slope)
and then the uptrend. The RSI indicator shows cycling between
overbought and oversold and so the entries for buying then selling call
options if one is more a trader than an investor.
Having had favorable earnings I see this as part of a recession type
an investment portfolio with all-time high as the target and looking
to hold through the next quarterly earnings if the uptrend has no
major correction in the meanwhile. Slow and stead wins the race.
I

EUR-AUD Local Long From Rising Support! Buy!
Hello,Traders!
EUR-AUD is trading in an
Uptrend along the rising
Support line and after the
Retest we are seeing a
Nice bullish reaction from
The support so I think that
The price will go further up
Buy!
Like, comment and subscribe to help us grow!
Check out other forecasts below too!

USDCNH Could Go UP!USDCNH is making higher highs and seems very bullish without any divergence. So it could hit out TP!!!

APPLE Will Keep Growing! Buy!
Hello,Traders!
APPLE is trading in a strong
Uptrend along the rising support
So I am bullish biased on
The stock and I think it will
Go higher up to retest
The 174.5$ level
Buy!
Like, comment and subscribe to help us grow!
Check out other forecasts below too!

USD JPY Could Go Up!This pair looks pretty bullish as it follows higher highs and higher lows with no divergence or reversal pattern. So the chances are high. It will rise from here and hit the TP.

SPY Long Term Trending Up LONGOn the weekly chart, SPY has formed an inverted head and shoulders in the past
9 months Importantly price has now passed above the POC lines of the long term
and intermediate term volume profiles. The inverted head and shoulders pattern
is classical for a bullish bias for price action. Price has been cconsolidated about
the central VWAP of the anchored VWAP bands locked onto the covid lows.
SPY should now make an attempt to rise toward the 2022 high of 480.
The RSI indicator confirms the long term trend with increasing strength.
In consideration of this I will take a call option trade of the strike of
$415 to HKEX:425 with 90-120 DTE. Overall, the SPY weekly chart, suggests
a general market recovery is increasingly probable. Those keeping their powder
dry and staying ready with cash will be rewarded once the market slows down for
the summer and gets more active in the fall months/

GOLD Rebound From Support Ahead! Buy!
Hello,Traders!
GOLD is still trading in
An uptrend and despite some
Patchy price action as of late
We saw a confident pullbacks
Every time the rising support
Was retested so Gold hitting
The local resistance above
At 2007$ is quite likely
Buy!
Like, comment and subscribe to help us grow!
Check out other forecasts below too!

✅GOLD LONG FROM SUPPORT🚀
✅GOLD is trading along the
Rising support line and we
Saw a rebound lately so I think
There is a good chance that
Gold will retest the
Falling resistance above
LONG🚀
✅Like and subscribe to never miss a new idea!✅

GBP-USD Bullish Triangle Breakout! Buy!
Hello,Traders!
GBP-USD is trading in an
Uptrend and the pair broke
Out of the bullish triangle
Pattern so I am bullish biased
And a further move up
Is to be expected
Buy!
Like, comment and subscribe to help us grow!
Check out other forecasts below too!

✅USD_JPY SWING LONG🚀
✅USD_JPY is trading in an uptrend
And the bullish biased was reinforced
By the massive swing breakout
Of the key horizontal level of 135.00
Which is now a support so
After the pullback and retest
I think that the pair will go
Higher up to retest
The horizontal resistance
Above at 137.50
LONG🚀
✅Like and subscribe to never miss a new idea!✅

✅EUR_USD BUYING OPPORTUNITY|LONG🚀
✅EUR_USD is trading in an uptrend
And the bullish bias is confirmed
By the rebound we are seeing
After the pair retested the support
So I think the growth will continue
LONG🚀
✅Like and subscribe to never miss a new idea!✅
