HFCL LTD WORTH TRACKING FOR SHORT TERM HFCL Ltd. (Himachal Futuristic Communications Limited) is a telecom infrastructure enabler with a diverse portfolio spanning telecom equipment manufacturing, optical fiber cables, and turnkey services
Business Segments
- Telecom Products: Includes UBR radios, Wi-Fi access points, AI-driven network management, and home mesh routers.
- Optical Fiber Cables: Largest market share in OFC supplies.
- Defence: Offers electronic fuzes, thermal weapon sights, and surveillance radars.
- Passive Connectivity Solutions: Supplies cable assemblies and high-density cabinets.
- Aerospace & Automotive: Provides custom cable assemble
Forecasts suggest potential short-term targets between ₹91.66 and ₹93.60 for 2025. Meanwhile, long-term projections for 2026 indicate a possible price range of ₹146.02 to ₹149.07.
Uptrend

Massive 884% vertical in past 2 hours $IXHLInsane volume, this will be in billions of shares total today.
They've tried to halt it several times but market makers are pulling orders seconds before halt, something is going on they're trying to get their orders filled and avoid halts, we'll soon see why and what's behind all that.
NASDAQ:IXHL

Sail is sailing higher Here's a quick analysis of SAIL (Steel Authority of India Ltd.) stock:
Technical Overview
- Current Price: ₹122.61 INR
- Market Cap: ₹479.14 billion
- P/E Ratio: 22.56 (Moderate valuation)
- Dividend Yield: 1.72% (Stable returns)
- 52-Week Range: ₹99.15 - ₹175.35
Recent Trends
- The stock has been in a downtrend but is showing signs of reversal.
- Key Support Levels: ₹112.40 - ₹118.45.
- Breakout Potential: Analysts suggest a possible bullish trend with a 25% upside target.
Breakout Signals
- Double Rectangle & Falling Wedge Pattern: These formations indicate buyer dominance and a possible bullish trend.
- Key Resistance Level: ₹134 INR—recent trading action suggests a strong push above this level.
- Volume Surge: A 5% price increase with high trading volumes supports the breakout possibility.
Fundamental Insights
- Revenue & Profit: Recent results show degrowth in revenue and operating profit margins.
- Institutional Interest: FIIs (Foreign Institutional Investors) have been increasing their shareholding, which could indicate long-term confidence.
Investment Outlook
- Strengths: Strong institutional backing, potential trend reversal.
- Weaknesses: Near 52-week low, declining revenue.
- Opportunities: If the breakout holds, short-term gains could be significant.
- Threats: Market volatility, global steel demand fluctuations.🚀

Potential Upside in USOIL Amid Ongoing Wave StructureThere remains a potential for USOIL to strengthen on the weekly timeframe, where it is currently expected to be forming wave (b) of wave within a diagonal pattern. This suggests that the upside area to watch lies in the range of 64.92–70.96.

uptrend be ready for it and take action own riskin long term also having the uptrend and this idea only for education purpose take action on the own risk if any one want to do analysis of any stock comment me name i will give you chart idea

AGL - Bowl chart with a Golden cross- AGL is in a long-term uptrend.
- AGL made a golden cross on 04.08.2025 (MA50 & MA200).
- The price chart is forming a bowl of patterns.
- Price now (05.01.2025): $3.93.
- Price target: $7.62.
If the bowl pattern fails, cut loss when the intraday price is below $3.66.
IMO, amateur trader.

SUSDT Potential UpsidesHey Traders, in today's trading session we are monitoring SUSDT for a buying opportunity around 0.4890 zone, SUSDT is trading in an uptrend and currently is in a correction phase in which it is approaching the trend at 0.4890 support and resistance area.
Trade safe, Joe.

GBP-CAD Will Grow! Buy!
Hello,Traders!
GBP-CAD is trading in an
Uptrend and the pair
Made a bullish breakout
And a pullback so affter
The retest of the broken
Falling resistance which
Is now a support we will
Be expecting a further
Bullish move up
Buy!
Comment and subscribe to help us grow!
Check out other forecasts below too!
Disclosure: I am part of Trade Nation's Influencer program and receive a monthly fee for using their TradingView charts in my analysis.

Ripple Potential UpsidesHey Traders, in today's trading session we are monitoring XRPUSDT for a buying opportunity around 2.16 zone, Ripple is trading in an uptrend and currently is in a correction phase in which it is approaching the trend at 2.16 support and resistance area.
Trade safe, Joe.

Ethereum Potential UpsidesHey Traders, in today's trading session we are monitoring ETHUSDT for a buying opportunity around 1780 zone, Ethereum is trading in an uptrend and currently is in a correction phase in which it is approaching the trend at 1780 support and resistance area.
Trade safe, Joe.

Novo Nordisk's The recent drop in Novo Nordisk's stock price is attributed to several factors. A key issue is the company’s struggle to meet the surging demand for its weight-loss drugs, such as Wegovy. Although demand remains strong, investors are concerned about Novo Nordisk's ability to scale up production and deliveries, which is creating downward pressure on the stock.
Additionally, some recent financial results failed to meet Wall Street expectations. Despite revenue growth in key product categories, overall revenues in some reports came in below forecasts. This underperformance has contributed to a negative investor sentiment.
However, analysts emphasize that Novo Nordisk's core products remain in high demand, and the company has significant long-term growth potential if it addresses its supply chain and production challenges

GBP-NZD Swing Long! Buy!
Hello,Traders!
GBP-NZD made a bullish
Rebound from the rising
Support line so we are
Bullish biased and we
Will be expecting a
Further bullish move up
Buy!
Comment and subscribe to help us grow!
Check out other forecasts below too!
Disclosure: I am part of Trade Nation's Influencer program and receive a monthly fee for using their TradingView charts in my analysis.

JPYIDR Continues Its Uptrend: Strength Momentum Remains IntactI estimate that JPYIDR is currently in its uptrend phase, forming part of wave (iii) of wave . This indicates that JPYIDR still has room to strengthen, with the nearest upside target projected in the 122–128 range.

GBP_NZD LONG FROM RISING SUPPORT|
✅GBP_NZD is trading along the rising support line
And as the pair is going up now
After the retest of the line
I am expecting the price to keep growing
To retest the supply levels above around 2.2532
LONG🚀
✅Like and subscribe to never miss a new idea!✅
Disclosure: I am part of Trade Nation's Influencer program and receive a monthly fee for using their TradingView charts in my analysis.

Review and plan for 21st April 2025Nifty future and banknifty future analysis and intraday plan in kannada.
Quarterly results.
This video is for information/education purpose only. you are 100% responsible for any actions you take by reading/viewing this post.
please consult your financial advisor before taking any action.
----Vinaykumar hiremath, CMT

CHF-JPY Will Go UP! Buy!
Hello,Traders!
CHF-JPY is trading in an
Uptrend and the pair is
Hovering just above the
Horizontal support level
Around 172.900 so we
Are bullish biased and
We will be expecting a
Swing move up on Monday
Buy!
Comment and subscribe to help us grow!
Check out other forecasts below too!
Disclosure: I am part of Trade Nation's Influencer program and receive a monthly fee for using their TradingView charts in my analysis.

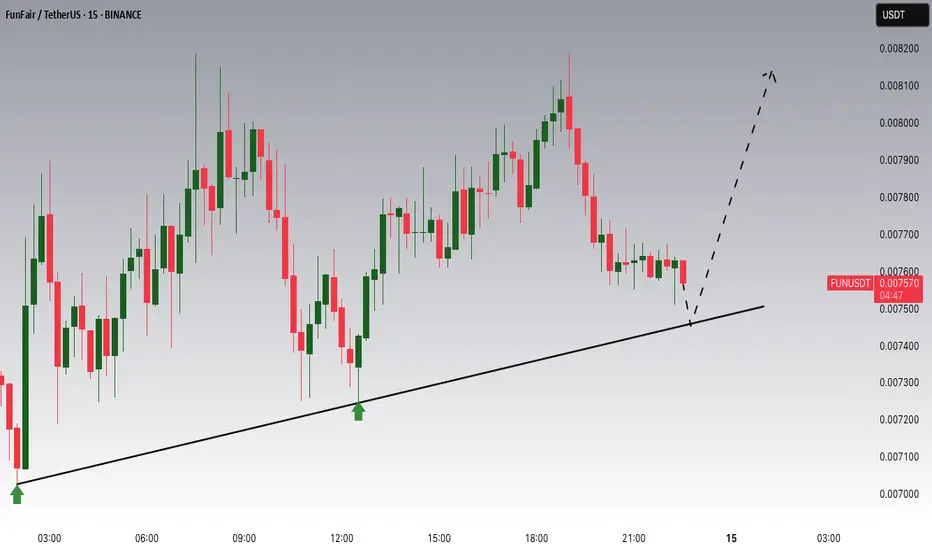
FUN/USDT In an Uptrend, Watching for Correction at Key SupportFUN/USDT has been in a solid uptrend, but we are now seeing a correction phase. The price is approaching a critical support zone around 0.007460, where previous price action has shown both support and resistance. This level is important to watch, as it could provide a potential buying opportunity if price reacts here. A break below could suggest further downside, but if support holds, a bounce toward the recent highs is possible. Monitoring closely for confirmation at this key level.
BAC on the UPTRENDBAC has completed the correction. Now running on the Uptrend.
On chart frame WEEK, the price was crossed MA200 then back up.
On chart frame Day, the volume so high and RSI look good.
It's mean, the Uptrend started from 04.09.25.
In the short term, the price still has to come back to fill at least 1 or 2 gaps that it has just created.
Price target: $43.63
Price entry: $37.99 (Today, 04.15.25).
Price stoploss: $36.20
R/R: 3.15.
IMO amateur trader.
Good luck!

EUR_USD STRONG BULLISH BIAS|LONG|
✅EUR_USD is trading in an
Uptrend and the pair is going
Down in a long-awaited bearish
Correction so after the retest
Of the demand level below
Around 1.1200 we will be
Expecting a local bullish rebound
LONG🚀
✅Like and subscribe to never miss a new idea!✅
Disclosure: I am part of Trade Nation's Influencer program and receive a monthly fee for using their TradingView charts in my analysis.

BTC: Time to buy?After having supported the 75k support and breaking the downward resistance (yellow), I understand that it could be a good sign for a rise. Waiting for 100k again?

GOLD All Key Levels! Buy!
Hello,Traders!
GOLD is trading in a MASSIVE
Uptrend and the slope of the
Price increase is getting steeper
And steeper which begs a question
Of how sustainable is this growth
In the future, however we are
Still bullish biased as the turmoil
In the markets makes makes Gold
Particularly attractive as a safe
Haven asset and so the next
Target seems to be a strong
Psychological level of 3300$
Buy!
Comment and subscribe to help us grow!
Check out other forecasts below too!
Disclosure: I am part of Trade Nation's Influencer program and receive a monthly fee for using their TradingView charts in my analysis.

EUR_USD SWING LONG|
✅EUR_USD made a strong
Breakout of the massive wide
Key horizontal level of 1.1235
Which is now a support and
As the breakout is confirmed
And the pair is in a strong
Uptrend our bullish bias is
Confirmed and we will be
Expecting further growth
On Monday
LONG🚀
✅Like and subscribe to never miss a new idea!✅
Disclosure: I am part of Trade Nation's Influencer program and receive a monthly fee for using their TradingView charts in my analysis.

EUR-GBP Bullish Bias! Buy!
Hello,Traders!
EUR-GBP is trading in a
Strong uptrend and the pair
Made a bullish breakout of
The key horizontal level
Of 0.8623 then surged
Further up and is now
Making a local bearish
Correction so we are
Bullish biased and after
The retest of the new
Support level we will be
Expecting a further
Bullish move up
Buy!
Comment and subscribe to help us grow!
Check out other forecasts below too!
Disclosure: I am part of Trade Nation's Influencer program and receive a monthly fee for using their TradingView charts in my analysis.
