Uptrend
Will Monday Bring a Breakout or a Correction?Last week was characterized by extreme volatility, with price movements reflecting significant reactions across different trading sessions. On Friday, the Asian session managed to push past the $3057 mark, only for early European trading to see a pullback. However, the US session reversed course, fueling a rally that extended until market close.
Key Levels to Watch on Monday
Looking ahead, the critical question is whether the Asian session can break above $3086, potentially paving the way for a push beyond $3100. If this breakout fails, we could see a price correction similar to Friday's, especially during European trading.
At present, I'm taking a cautious approach, observing the market while many anticipate further upside. While momentum appears strong, I prefer to wait for clearer confirmations before making a move.
Potential Scenarios
Breakout Above $3086
A successful push above this level could signal continuation toward $3100+, reinforcing the bullish sentiment.
Failure at $3086 – Potential Pullback
If the market struggles to sustain levels above $3086, a decline to $3076 is likely.
A break below $3076 could see further downside to $3067 and possibly lower.
Technical Indicators & Market Sentiment
RSI (1H): Currently at 52, indicating neutral momentum.
RSI (4H): Around 90, showing overbought conditions—especially following the Asian session rally.
Market Sentiment:
Many traders expect an upward continuation, but caution is warranted given overbought signals and the possibility of a correction.
External Factors: Tariffs & Global Trends
As we approach April 2nd, when new tariffs take effect, global markets have been showing signs of weakness. Uncertainty persists, and with gold acting as a safe haven, investors may seek protection, adding another layer of complexity to Monday’s price action.
Conclusion
The start of the week will likely be dictated by whether the Asian session can achieve a breakout above $3086. If it does, bullish momentum could drive prices higher. However, failure at this level could result in a correction, with key support levels at $3076 and $3067 in focus. Given the broader market conditions and upcoming economic events, a cautious approach remains prudent.
📉 Will Monday bring a correction, or is there still room for another rally? Share your thoughts in the comments! 🚀
-------------------------------------------------------------------------
This is just my personal market idea and not financial advice! 📢 Trading gold and other financial instruments carries risks – only invest what you can afford to lose. Always do your own analysis, use solid risk management, and trade responsibly.
Good luck and safe trading! 🚀📊
Trend Reversal in Play?After a strong bearish channel that lasted several weeks, the market has finally broken out of the resistance level — a key technical signal. This breakout was followed by higher lows and higher highs, suggesting a possible shift in momentum. 📈
Volume has also increased noticeably around the breakout zone, which can signal stronger conviction from buyers. The question now is: Are we entering a new uptrend?
As long as the price holds above the broken resistance (now acting as support), bulls could take control. Traders should keep an eye on key support zones and potential continuation patterns to confirm the trend reversal.
👉 What do you think — new rally or a bull trap?
GBP_CHF LONG SIGNAL|
✅GBP_CHF is trading in an uptrend
Along the rising support line
Which makes me bullish biased
And the pair is about to retest the rising support
Thus, a rebound and a move up is expected
So we can enter a long trade with
The TP of 1.1410 and SL of 1.1350
LONG🚀
✅Like and subscribe to never miss a new idea!✅
Disclosure: I am part of Trade Nation's Influencer program and receive a monthly fee for using their TradingView charts in my analysis.
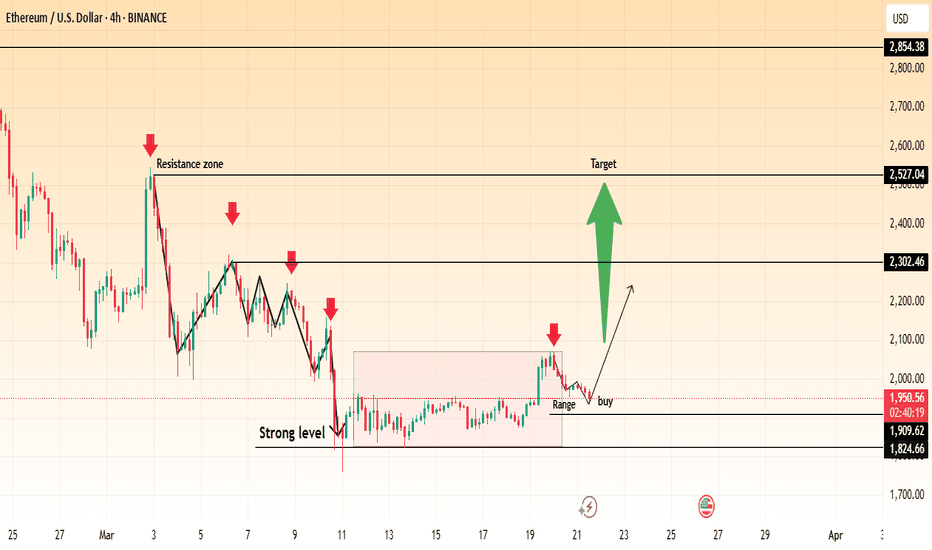
Ethereum (ETH/USD) – Potential Breakout from Range Towards $2,50📊 Chart Insights:
ETH/USD is currently ranging near the $1,950 zone, following a consolidation phase.
A strong resistance zone is visible between $2,302 - $2,527, which has historically acted as a rejection point.
Support levels are established around $1,824 - $1,909, forming a strong base for price action.
A breakout above the current range could signal a bullish move toward the $2,302 resistance level, with a further target at $2,527.
📈 Trading Plan:
✅ Entry: Buy above $1,966 on confirmation of breakout.
🎯 Targets: $2,302 and $2,527 for profit-taking.
❌ Stop Loss: Below $1,909 to manage risk.
📉 Bearish Scenario: If ETH fails to hold $1,909, a retest of $1,824 is possible.
🔥 Ethereum could see a strong rally if momentum builds above resistance! Are you ready?
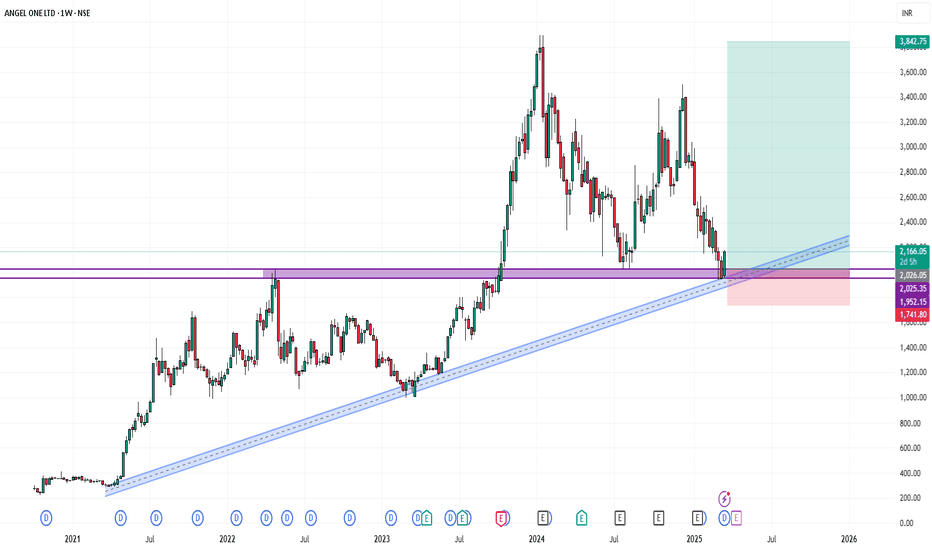
SWING IDEA - ANGELONE
ANGELONE
's stock price has been retesting around the 2000 resistance level for approximately two and half years. Following multiple retest, the stock finally broke out above this level in October 2023 and has since established it as a key support.
The stock subsequently surged to a peak of 3895, representing a 87% increase. However, it then experienced a sharp correction, plummeting 45% to revisit the 2000 support level again. This pivotal point, formerly a resistance, has now become a robust support.
Currently, ANGELONE is exhibiting an upward momentum, poised to retest its swing high at 3895. The weekly MACD crossover, occurring after the establishment of support at 2000, indicates a bullish trend reversal.
KEY OBSERVATIONS:
- Two-year resistance level of 2000 broken in October 2023
- Stock surged 87% to 3895 before correcting 45%
- 2000 level now serves as robust support
- Weekly MACD crossover indicates bullish momentum
- Upward momentum poised to retest swing high at 3895
RECOMMENDATION:
Based on this technical analysis, I would recommend holding ANGELONE for a Long Term horizon. This could potentially yield:
- 35% returns from the current price (as of writing)
- 87% returns from the support point (2000)
This analysis highlights a compelling buying opportunity in ANGELONE, driven by its breakout and momentum reversal.
IMPORTANT NOTE: Investors should be aware that there is a possibility that the stock may revisit this Support level at 2000 in the near future before resuming its upward momentum towards the swing high at 3895. This potential pullback should be monitored closely, and investors may consider adjusting their strategies accordingly.
DISCLAIMER: This IDEA is for informational/educational purposes only and should not be considered as investment advice. The analysis presented is based on technical indicators and historical data but does not guarantee future performance. Please conduct thorough research based on financial goals and risk tolerance, and consult with a financial advisor before making any investment decisions.
Analysis of USD/JPY Chart**Analysis of USD/JPY Chart**
**Chart Pattern & Market Structure**
- The chart identifies a **triangle chart pattern**, which often signals a potential breakout.
- Price has been consolidating within this structure and recently **broke above the pattern**, indicating possible bullish momentum.
**Key Technical Levels**
- **Resistance Zone (~149.8 - 150.0):** Price is testing this area, which previously acted as a supply zone. A breakout above could open doors for higher levels.
- **Support Zone (~148.5 - 149.0):** If price retraces, this area could act as a strong demand zone.
- **EMA50 (~149.2):** Currently acting as a dynamic support, maintaining the bullish structure.
**Potential Price Movement**
- The chart suggests a possible pullback toward **support** before continuing higher toward the next resistance zone (~151.5 - 152.0).
- If price breaks below the **support zone**, the uptrend could weaken, leading to a bearish scenario.
**Trading Considerations**
- A **successful breakout above resistance** (~150) could push price towards **152.0**.
- A **rejection at resistance** might bring price back to **support (~148.5 - 149.0)** before another bullish attempt.
- Traders should watch for **confirmation signals** (candlestick patterns, volume spikes) before entering trades.
AUD-JPY Bullish Continuation Expected! Buy!
Hello,Traders!
AUD-JPY is trading in a
Local uptrend and the pair
Made a bearish correction
And then retested the
Horizontal support of 94.595
And we are already seeing a
Bullish reaction from the
Support so as we are
Locally bullish biased
And we will be expecting
A further bullish move up
Buy!
Comment and subscribe to help us grow!
Check out other forecasts below too!
Disclosure: I am part of Trade Nation's Influencer program and receive a monthly fee for using their TradingView charts in my analysis.
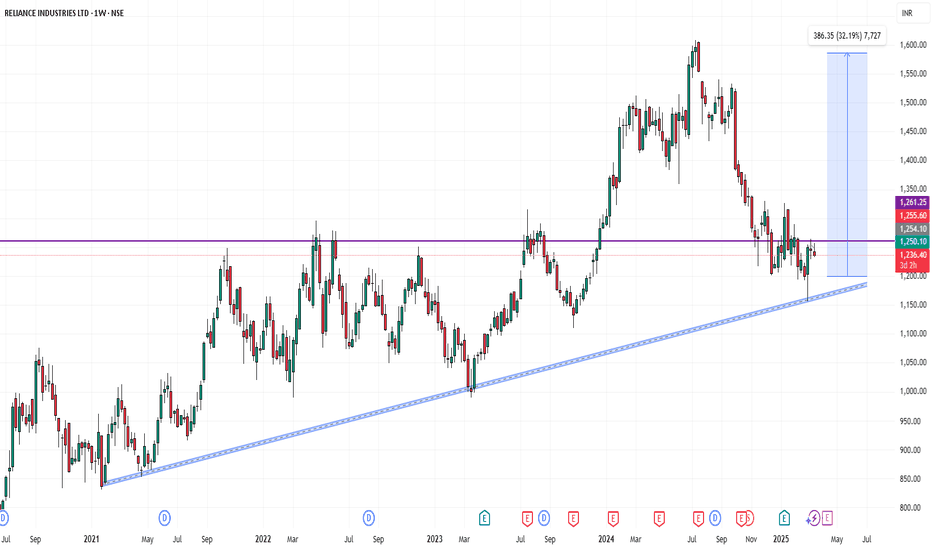
Reliance Industries📈 Reliance Industries Breakout Alert – ₹1241 Key Level Breached 🚀
Reliance Industries has successfully broken out above a strong resistance zone near ₹1241, indicating a potential bullish move ahead. This level acted as a critical supply zone in the past, and the breakout with volume confirmation adds strength to the trend.
🔍 Technical Highlights:
Breakout Level: ₹1241
Volume: Above average (confirming strength)
Trend: Bullish
Next Resistance Zones: ₹1265 / ₹1290
Support Zones: ₹1220 / ₹1200 (previous resistance now acting as support)
Gold ($XAUUSD) Continuation Bullish TrendGold ( OANDA:XAUUSD ) Market Update Bullish
#### **Current Trend: Bullish**
- Gold has been in an **uptrend**, trading near the **$2,990 level**.
- Price remains **above key moving averages (EMAs)**, which signals continued buying pressure.
- The market is consolidating after a strong rally, meaning traders are taking a breather before the next move.
#### **Key Levels to Watch:**
1. **Resistance:**
- **$2,995:** If gold breaks above this level, it could trigger a strong **bullish move**.
- **$3,000:** A psychological level that could attract more buyers and push the price even higher.
2. **Support:**
- **$2,985:** If this level holds, gold may continue moving up.
- **$2,971:** If price drops below this, we could see a deeper **retracement or pullback**.
#### **Potential Scenarios:**
- **Bullish Scenario:** If gold **breaks above $2,995**, we could see a move towards **$3,010 or higher**.
- **Bearish Scenario:** If gold **falls below $2,985**, it might retrace towards **$2,971**, where buyers may step in again.
💡 **Conclusion:**
Gold is currently in a strong bullish trend, but traders should **watch for a breakout above resistance** or **a pullback to support before re-entering**. Stay updated and use proper risk management! 🚀💰
EUR-AUD Will Go UP! Buy!
Hello,Traders!
EUR-AUD is trading in an
Uptrend and we are now
Seeing a nice bullish reaction
From the horizontal support
Of 1.7153 which reinforces our
Bullish bias and we will be
Expecting the pair grow more
With the target of 1.7417
Buy!
Comment and subscribe to help us grow!
Check out other forecasts below too!
Disclosure: I am part of Trade Nation's Influencer program and receive a monthly fee for using their TradingView charts in my analysis.
SILVER WILL KEEP GROWING|LONG|
✅SILVER is trading in a
Strong uptrend and we saw
A very strong bullish breakout
And the breakout is confirmed
So while I am expecting a potential
Correction and even a retest
Of a broken key level of 33.29$
I will be expecting a further
Move up and a retest of the
Horizontal resistance above
At around 34.84$
LONG🚀
✅Like and subscribe to never miss a new idea!✅
Disclosure: I am part of Trade Nation's Influencer program and receive a monthly fee for using their TradingView charts in my analysis.
SMPH Possible Trend ReversalAfter months of downtrend, SMPH seems to be somehow recovering from its bearish sentiment. From downtrend to sideways
Confluence
Macro: Shift from downtrend to sideways
Daily chart: higher lows
RSI: higher lows
Short term outlook: Looking like a 1 month short term uptrend.
Other Notes
Possibly looking to make a DB MB BO and hopefully a DB BT BO
Coming from a macro downtrend, sentiment shifting to defensive stocks. Property sector may not be the first mover post bearish sentiment since its not a defensive sector but perhaps the speculated rate cuts may help.
Earnings also released and looking good.
SAIL📊 Price Action & Trend Analysis
Analyzing market trends using price action, key support/resistance levels, and candlestick patterns to identify high-probability trade setups.
Always follow the trend and manage risk wisely!
Price Action Analysis Interprets Market Movements Using Patterns And Trends On Price Charts.
Jio Financial Services Ltd- The chart is self-explanatory as always.
- JIOFIN is reaching its ATL.
- The stock is down 40% since it started its downward trajectory.
- JIOFIN is to be added to Nifty50 by March end
-The company reported a slight 0.32% increase in consolidated net profit for Q3 FY25, with earnings of Rs 294.78 crore compared to Rs 293.82 crore in the same period last year. Revenue from operations rose by 5.98% to Rs 438.35 crore for the quarter ending December 2024.
Disclaimer: This analysis is purely for educational purposes and does not constitute trading advice. I am not a SEBI-registered advisor, and trading involves significant risk. Please consult with a financial advisor before making any investment decisions.
A great uptrend is upcoming!!!Hi everyone!
A great uptrend on Venice token is upcoming at the next months maybe weeks...
Trading volume start raising, interest getting higher, on Venice token will be a lot of attention soon!
That's why we are here to grab the opportunities before they even happen!
Of course some of you will have your doubts which we totally understand! But instead of doubting why you don't try our ideas with very little capital (0.50usdt) in order to test our strategy? Nothing to lose.
While the main chart shows lot's of bearish signals our experts sees gem and dollars..
All the plan is given to you for free..
Try it and thank us later!
Stay tuned for more
#MKRUSDT is gaining momentum🚀 LONG #MKRUSDT from $1485.0
🛡 Stop Loss: $1438.0
⏱ 1h Timeframe
🔹 Overview:
➡️ The asset is in a strong uptrend, forming a cascade of support levels with buyers stepping in.
➡️ The price recently tested a major resistance level ($1500) and entered a brief consolidation.
➡️ Patterns such as "expanding triangle" and "rising wedge" confirm strong activity and accumulation.
➡️ The current POC zone (1197) indicates high buying interest, supporting further upside movement.
⚡ Plan:
➡️ Going long from $1485.0, anticipating a breakout above the local high.
➡️ Taking profits at TP levels with potential partial exits.
🎯 TP Targets:
💎 TP 1: $1500.0
💎 TP 2: $1530.0
💎 TP 3: $1554.0
📢 #MKRUSDT is gaining momentum — preparing for an upward move!
BNX is not for shorting!!!YET..Hi everyone,
BNX made a massive pump of almost 35%..
The coin is still on a uptrend!
Open a short position right now would be harmfull for your portofolio..
Of course is depends of what percentage you are after..
Trade safe!
BNX Soars to New Heights: A Strong Uptrend Signals Promising FutHi everyone!
BNX is on uptrend and is the perfect moment to buy with price target 1.23.
Shorting this coin would be a massive mistake as smarts money plan is to sweep the shorts!!
Chart looks bearish but don't fall in to their trap!
If you open a long position make sure you are covered for at least 25% drop. Avoid the high leverage! Remember profit is greater that loss.
We are not day traders. just profitable traders!
Our job is to identify the trend.
Trade safe


