HelenP. I Gold will break resistance level and continue to growHi folks today I'm prepared for you Euro analytics. After a strong bullish impulse, the price managed to break above the local resistance zone and reach the 3365 level. This zone had previously acted as a barrier for upward movement, but now the price is consolidating just below it, forming a possible correction setup. I see that price followed a clear trend line during its recent rally, and multiple times this line acted as dynamic support. The buyers respected it and entered the market with each touch. Currently, Gold is hovering near the upper boundary of the resistance zone. I expect that before continuing to grow, the price may make a slight correction toward the trend line, using it again as a support for a potential rebound. This would also allow the market to gather more liquidity before targeting new highs. Once the correction completes and the trend line holds, I expect gold to rise again, break through the 3365 resistance level, and continue its upward movement toward 3400 points, which is my main goal for this setup. Given the strong trend, the bullish impulse, and clear support from the trend line, I remain optimistic and anticipate further growth. If you like my analytics you may support me with your like/comment.❤️
Disclaimer: As part of ThinkMarkets’ Influencer Program, I am sponsored to share and publish their charts in my analysis.
Upward
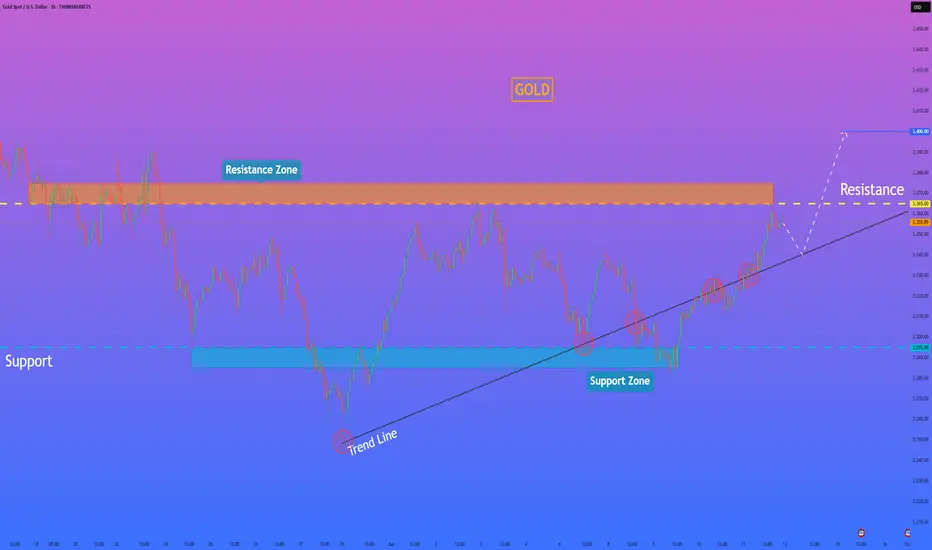
Gold can reach resistance level, break it and continue to riseHello traders, I want share with you my opinion about Gold. Recently, price formed a clean upward wedge pattern and is showing strong bullish behaviour. After bouncing off the support level at 3275, the price entered the buyer zone (3255 - 3275) and reversed with a confident impulse up, signalling renewed interest from buyers. From there, price has consistently respected the support line, printing higher lows and slowly climbing back toward the resistance level at 3410. This level has acted as a significant rejection area before, but this time, the structure looks stronger. Each pull-back has been shallow, and buyers are stepping in faster. The momentum is slowly building. Now the price is trading just below resistance and moving with a bullish trajectory. I expect Gold to continue its climb, first reaching the Resistance Level, and then targeting the seller zone (3410 - 3430). That’s why I’ve set my TP at 3430 points - right inside this upper area where I anticipate profit-taking and potential reversal. Given the bullish pattern structure, the wedge formation, and the strength of recent impulses, I stay bullish and expect further growth in the coming sessions. Please share this idea with your friends and click Boost 🚀
Disclaimer: As part of ThinkMarkets’ Influencer Program, I am sponsored to share and publish their charts in my analysis.

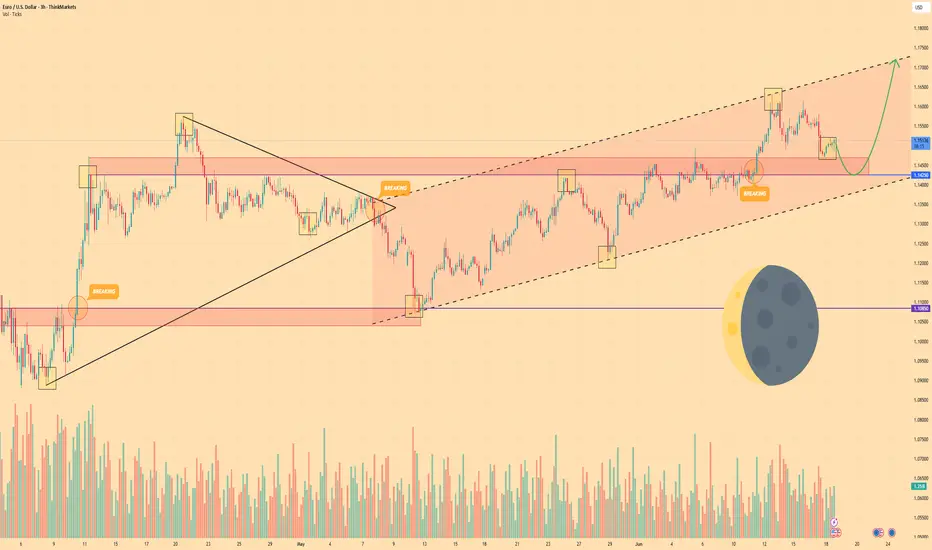
EURO - Price can correct to support area and then continue riseHi guys, this is my overview for EURUSD, feel free to check it and write your feedback in comments👊
Some days ago, price declined below support level and then started to grow inside a triangle pattern.
In this pattern, Euro broke $1.1085 level and even rose higher than $1.1425 level, but soon made a correction.
Later price exited from triangle and fell to support level, after which it started to grow inside rising channel.
Inside channel, price rose near support line and later reached $1.1425 level one more time, and some time traded close.
Soon, Euro broke this level and rose to resistance line of channel and then started to move down.
In my opinion, EUR can fall to support area and then continue to grow in channel to $1.1720 resistance line.
If this post is useful to you, you can support me with like/boost and advice in comments❤️
Disclaimer: As part of ThinkMarkets’ Influencer Program, I am sponsored to share and publish their charts in my analysis.
HelenP. I Euro may correct to trend line and then rebound upHi folks today I'm prepared for you Gold analytics. After a sharp, impulsive rise, price entered a broad consolidation phase between 1.1575 and 1.1270 levels, creating a horizontal channel where price oscillated for several sessions. This type of structure often serves as a re-accumulation zone during a trending market. What's particularly notable is the recent touch of the lower boundary of the range, which coincided with a retest of both the ascending trend line and the support zone around 1.1270 points. This confluence of technical factors makes the current area critical for further price development. Following the bounce from the support zone, the pair is showing early signs of recovery. The trend line has held firmly, and buyers stepped in with a reaction candle confirming demand interest. While EUR is not yet out of the consolidation, the structure suggests strength and potential continuation. Given the alignment of the upward trend line, support zone validation, and stabilization after the drop, I expect that EURUSD may climb almost toward the upper boundary of the consolidation. That's why my current goal lies at 1.1500. If you like my analytics you may support me with your like/comment ❤️

EURO - Price can bounce up of support level to top part of flatHi guys, this is my overview for EURUSD, feel free to check it and write your feedback in comments👊
Some time ago price traded inside a triangle, where it broke $1.0920 level and then made a correction to this level.
Then price exited from triangle pattern, retesting and then made upward impulse to $1.1310 level, which coincided with support area.
Next, Euro started to traded inside flat, wher it soon broke $1.1310 level, but then it made correction.
After this movement, price in a short time rose to the top part of flat, where it turned around and bounced down to $1.1310 level.
Price tired to grow, but failed and continued to trading near this level, and even recently it bounced.
So, in this moment, I expect that Euro can bounce up from support level to $1.1575 top part of the flat.
If this post is useful to you, you can support me with like/boost and advice in comments❤️

EURO - Price can bounce from support level to top part of flatHi guys, this is my overview for EURUSD, feel free to check it and write your feedback in comments👊
Some days ago, price entered a wedge pattern, bounced down from the resistance line to the support line, and broke the $1.0415 level.
Next, the price turned around and started to grow. In a short time, it rose to the $1.0415 level and broke one more time.
Then, price some time traded between resistance line with $1.0415 level and later corrected to support line of wedge.
After this, EUR made a strong upward impulse, thereby exiting from wedge pattern and starting to trades inside flat.
In flat, price reached top part and then made a correction movement to $1.0735 support level and turned around.
In my mind, Euro can correct to support level and then rise to $1.0950 top part of flat.
If this post is useful to you, you can support me with like/boost and advice in comments❤️

Gold can continue moving up inside the upward channelHello traders, I want share with you my opinion about Gold. At the beginning of the chart, the price started to grow from the buyer zone between 2865–2880 points, entering the first upward channel, where it formed higher highs and higher lows. After multiple rejections from the resistance line, the price made a correction and exited the channel, but the overall bullish impulse remained intact. Following a brief consolidation in the support area between 3000–3015 points, GOLD launched another strong move upward, securing a position above the current support level at 3000. This zone has proven to be strong support and marked the beginning of a new upward channel. Currently, the price is trading confidently inside this second upward channel. After a minor correction to the midline, GOLD continued its upward trajectory. I expect a short-term pullback, but as long as the support holds, the bullish trend is likely to continue. My main scenario assumes that GOLD will stay within the channel and move toward TP1, which is set at 3135 points. Given the bullish structure, solid reaction from support, and clear upward momentum, I remain bullish and anticipate further growth. Please share this idea with your friends and click Boost 🚀

BITCOIN - Price can reach support level and then start to growHi guys, this is my overview for BTCUSDT, feel free to check it and write your feedback in comments👊
Some time ago, the price long time traded near $83700 level, broke it and started to grow inside an upward wedge.
Firstly, BTC rose to the resistance line of the wedge and then corrected to the support level, after which it reached the $87800 level.
After several attempts to break resistance, price turned around and dropped, thereby exiting from wedge.
Now it is correcting and approaching support level, slowly moving toward $83700 key support level.
In my opinion, when BTC reaches $83700 level, it can turn around and start to grow to the $87800 resistance level.
If this post is useful to you, you can support me with like/boost and advice in comments❤️

Intel aiming to previous two bottomsIntel is probably aiming to harvest a lot of liquidity from the previous two bottoms.

USDCHF continuing upwardUSDCHF pullback to 1H order block to continuing upward after consolidation , target next resistance. Also RSI support upward because it above 70


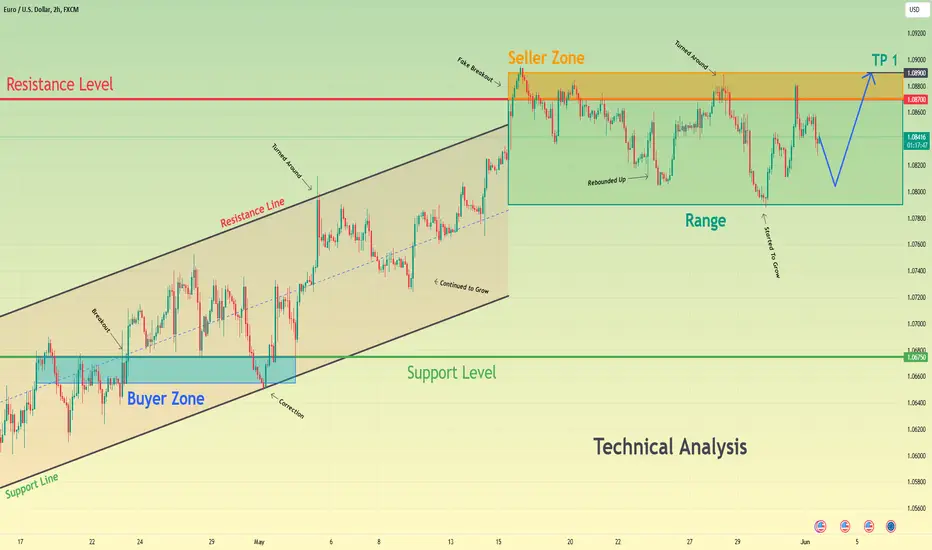
Euro can fall to bottom part of range and then bounce upHello traders, I want share with you my opinion about Euro. By observing the chart, we can see that the price entered an upward channel, where it soon reached the support level, which coincided with the buyer zone and broke it. After this, EUR a little rose, after which made a correction movement to the support line of the channel and then in a short time rose to the resistance line of the channel. Then the price turned around, a little declined, after which continued to move up inside an upward channel. Later price exited from this channel, and even entered to seller zone, but soon turned around and started to trades in the range, making a fake breakout of 1.0870 resistance level. Inside the range, the price fell almost to the bottom part, after which rose back to the seller zone, but at once turned around and fell again. After which, EUR started to grow and in a short time rose to a resistance level and a not long time ago turned around and started to decline. Now I think the price can decline to almost the bottom part of the range and then rebound up to the seller zone. For this reason, I set my target at 1.0890 points, which is located in the seller zone. Please share this idea with your friends and click Boost 🚀
Beautiful wedge on $BTC over several supportsClear wedge forming on CRYPTOCAP:BTC over several supports:
- Parallel multiyear channel
- Important VWAP quarter horizontal line (orange line that coincides with a Fib Level - blue line)
- Fib Level (blue line) from last flag in February
- Insinuating over wedge ceiling line (dark blue)
So, we have a very good confluence there; maybe a scary quick drop possible to reach the bottom of the wedge, there on the confluence of already signaled fib level and VWAP quarter lines of support
The target of this wedge is the all-times-high (red line, past 72k usd)

Gold can start decline to support line of upward channelHello traders, I want share with you my opinion about Gold. Observing the chart, we can see that the price reached the support level, which coincided with the buyer zone, and soon broke this level and continued to grow inside the pennant. In this pattern, XAU rose to the current support level, which coincided with the support area, and even rose higher and reached the resistance line, after which turned around and made a correction to the support line of the pennant. Later price reached the 2400 level again and then made a strong downward impulse to the buyer zone, exiting from the pennant pattern and breaking the 2290 level. But soon, the price turned around and started to grow inside the upward channel, where it soon broke the 2290 level again. Next, Gold reached the resistance line, and made corrections to the support line, after which rebounded up to the support area, breaking the 2400 support level. As well recently, the price rose higher than the support area and now trades close to the resistance line of the upward channel. In my opinion, Gold can rebound from the resistance line and decline to the support line of the upward channel, breaking the current support level. For this case, I set my target at the 2370. points, which coincided with the support line of the channel. Please share this idea with your friends and click Boost 🚀

Euro can reach resistance level and then start to declineHello traders, I want share with you my opinion about Euro. By observing the chart, we can see that the price some days ago rebounded from the support level, which coincided with the support area and started to grow to the resistance level. In a short time price reached the 1.0895 level, which coincided with the seller zone and soon broke it, after which it even rose a little more, but then turned around and started to decline inside the downward channel. In the channel, EUR broke the resistance level one more time and declined to the support area, which coincided with the support line of the channel. But soon, the price turned around and made an upward impulse, thereby making a fake breakout of the support level and later even exiting from the downward channel. After this move, the price declined inside the triangle from the resistance line to the support line, breaking the 1.0735 level. The Euro turned around from the support line of the triangle and in a short time rose to the 1.0735 level and soon broke it again, after which continued to rise to the resistance line of the pattern. Next, the price exited from the triangle pattern and soon reached a resistance level, but recently it rolled down and now the price tried to rise. But in my opinion, it can reach a resistance level and then start to decline. For this reason, I set my target at 1.0800 points. Please share this idea with your friends and click Boost 🚀

After exiting from triangle, Ethereum can continue to growHello traders, I want share with you my opinion about Ethereum. Looking at the chart, we can see how the price declined to the resistance level, which coincided with the seller zone and even fell below this level but soon backed up to the seller zone. ETH some time traded in this area and later rebounded up to 3717 points, after which it turned around and made a downward impulse to the support level, which coincided with the buyer zone, breaking the 3360 level. Also, the price started to trades inside the triangle, where it bounced from the 2875 level and started to grow to the resistance line, which their moment coincided with the resistance level, after which it rebounded and fell to the buyer zone. But soon Ethereum turned around and rose back to the resistance line, but couldn't fixed and fell back to the support level. Some time later price made an upward impulse from this level and a not long time ago Ethereum exited from the triangle pattern. Now I think the price can make a small correction move and then continue to grow. For this case, I set my target at the 3360 level. Please share this idea with your friends and click Boost 🚀

Bitcoin can correct to mirror line and then rebound upHello traders, I want share with you my opinion about Bitcoin. Observing the chart, we can see that the price a not long time ago rebounded from the mirror line and made a strong upward impulse to the current support level, which coincided with the support level, thereby breaking the 60300 support level also. After this, the price started to trades inside the range, where it at once made a correction movement from the 65100 level to the mirror line, after which bounced up. But soon BTC fell to the 60300 level, breaking this line, and some time traded near the support level, after which rose back to the mirror line and broke it again. Then the price declined again, after which made a strong upward impulse, breaking the mirror line and 65100 support level, thereby exiting from the range as well. After this movement, BTC made a correction to the mirror line and then rebounded back and now it continues to grow. So, in my opinion, Bitcoin can repeat the correction move to the mirror line, and then continue to move up. For this case, I set my target at 68500 points. Please share this idea with your friends and click Boost 🚀

British Pound can reach seller zone and then start to declineHello traders, I want share with you my opinion about British Pound. By observing the chart, we can see that the price a not long time ago started to trades inside a downward wedge, where it rebounded from the support line and rose to the resistance line, coinciding with the resistance level with the seller zone. After this move, GBP turned around and in a short time declined to the buyer zone, breaking the support level and soon declined more and reached the support line of the wedge. Then price rebounded from this line and soon exited from the wedge, after which continued to move up inside the upward channel, where GBP soon broke the 1.2450 support level also. After this, the price rose to the resistance line of the channel and then corrected to the support line, after which rebounded and in a short time rose to the resistance level. At the moment, GBP continues to trades near this level and I think that the British Pound can reach the seller zone and then start to decline to support line of upward channel. For this reason, I set my target at 1.2575 points. Please share this idea with your friends and click Boost 🚀

Gold can bounce from resistance line and start to declineHello traders, I want share with you my opinion about Gold. Looking at the chart, we can see how the price a few moments ago entered to upward wedge, where it at once made a strong upward impulse from the support line to the resistance level, and even soon broke it, breaking the support level also. After this, XAU rose a little more, after which made a correction move, below the 2380 level, but soon turned around and rose to the resistance line of the wedge, breaking this level again. Next, Gold turned around and in a short time declined to almost to 2290 support level, which coincided with the buyer zone and some time traded near this level. As well later price made a fake breakout of the 2290 level, after which rebounded up to the resistance line of the wedge, but at once bounced down. Soon XAU turned around and rose back to the resistance line and at the moment continues to trades near this line. For this case, I think that Gold can make a move up to the resistance level and then start to decline in the wedge. So, that's why I set my target at 2320 points. Please share this idea with your friends and click Boost 🚀

Gold can continue to grow to resistance line of pennantHello traders, I want share with you my opinion about Gold.Looking at the chart, we can see how the price some days ago entered to upward pennant, where it at once rebounded from the support line and made a strong upward impulse to the resistance line, thereby breaking 2285 and 2380 levels. After this movement, Gold turned around and in a short time declined lower than the 2380 resistance level, which coincided with the seller zone, thereby breaking it one more time. Later XAU declined to the 2285 support level, which coincided with the support area, and at once bounced up and tried to rise, but failed and declined back to the support level, which coincided with the support line of the pennant as well. After this movement, Gold a not long time ago rebounded and started to move up, therefore I think the price can decline to the support line again and then rebound up to the resistance line of the upward pennant. For this case, I set my target at 2365 points, which coincided with this line and resistance level also. Please share this idea with your friends and click Boost 🚀

EUR/USD: Price Increase Outlook in the Upcoming PeriodEUR/USD responded to new demand and rose to 1.0750 in the European trading session on Thursday.
From a technical perspective, a positive signal is emerging as EUR/USD may be forming aa cup and handle. In this scenario, the expectation is for the price to continue rising to the first resistance level at 1.0727, followed by the psychological milestone of 1.0885.

Technical Analysis: Bullish Outlook for USD/JPY Still ContinuesUSD/JPY is currently at multi-decade highs, closing at 155.00. Traders are exercising caution due to increased risks stemming from Japan's forex intervention. The recovery of the US dollar (USD) is bolstering the upward momentum of USD/JPY.
From a technical standpoint, the pair is trading above the Simple Moving Averages (SMA), indicating a stable uptrend. However, there are signs of a corrective move, with prices expected to test the 0.5-0.618 Fibonacci retracement levels before resuming a strong upward trajectory

EUR/USD Holds Steady at 1.0700 Level with Positive IFO DataIn the European trading session on Wednesday, the EUR/USD pair continued to close steadily around the 1.0700 level. Positive sentiment from Germany's IFO psychological data helped stabilize the Euro.
On the 4-hour chart, despite recent price declines, the Simple Moving Average SMA 20 remains above the SMA 50 after completing a bullish crossover on Tuesday. Additionally, the Relative Strength Index (RSI) consistently stays above 50.
