AUDUSD: Harmonic Movement & Bearish Forecast
AUDUSD retesting the recently broken trendline.
we have a very nice match between a horizontal structure, projected harmonic movement completion and the above-mentioned trend line.
based on that the price may drop lower.
intial target : 0.6966
p.s a lot of fundamentals today! no matter what is your view on market atm, try to trade with trailing stop to catch a big winner.
good luck
US-DOLLAR

Dollar, Show us your STRENGTH!
dxy reached a key 3 days/daily structure.
on 4H the price set a double bottom pattern with a higher low.
looks like greenback is finally preparing for a pullback.
the last resort for bears is 97.05 resistance.
if bulls manage to close above this level on 4H, the price will most likely keep growing further.
target levels:
97.5
97.8
in case of a new lower low formation, the market will go lower.
next goal will be 95.9

Gold: Daily Posoitioning and Macroecnomic Analaysis If the market actually believed and is pricing in that the United States is infact transitioning from deflationingary to a recession, this doesn't negate the true possbility of turning to stagflatioon as a transitionary result of the current FED stimulus rather than a "V shaped recovery". I've been bullish since 1,200 and I can promise I've remained bullish longer than the bears against my treasury and gold calls over the years. This is a direct attack at the establisment, who looks to market up there book anyway, which I digress.
What I'm concerned is that if the data beyond June and July is Quad 2 (positive economy growth with validated and justifiable increases in both inflation and real G.D.P. growth. However, this isn't the case. If this way, you would see me selling gold, as this is an auto risk-management. However, when treasuries and gold goes bearish, I will buy the finaincial,s and the russell 2000. Understand that I am a longterm analyst that doesn't rely on the SPY to click bate you into my trading course.
13:34:20 (UTC)
Wed Jun 3, 2020

Gold Bullish Upside Target 01:14:22 (UTC) Wed Jun 3, 2020Gold Bullish Upside Target
01:14:22 (UTC) Wed Jun 3, 2020

USDCAD: Key Weekly Levels
USDCAD is falling like crazy.
here are the strongest key weekly support levels to catch a pullback:
support 1 - 1.33 - 1.335 area based on a major rising trendline and a horizontal structure
support 2 - 1.30 level based on a horizontal structure
Closest key resistance:
1.37 - 1.38 area based on a horizontal structure
also, many questions about the current price level 1.35
it is also a strong structure level, however, the reaction from it will be most likely quite limited so I have just neglected it on purpose.
however, if you see a decent opportunity on that, why not to try to catch it)

EURUSD: Key Levels
EURUSD started a strong bullish movement.
Multiple strong resistances are ahead.
Key levels based on 3 days chart analysis:
Resistance 1 - 1.11 level based on a resistance line of a major channel + horizontal 3 days/daily structure
Resistance 2 - 1.12 level based on a horizontal weekly/3 days/daily structure
Resistance 3 - 1.15 levels based on a horizontal weekly/3 day/daily structure + it is this year's high
Closest supports are:
Support 1 - 1.0975 level based on a recently broken daily structure
Support 2 - 1.08 level based on a horizontal 3 days/daily structure
pay attention to the lower timeframe once the market reaches one of these levels to catch a pullback or reverse

GBPUSD May Keep Growing Next Week!
GBPUSD is trading within a rising parallel channel .
Next week we can expect a bullish continuation from its support.
The next goal for buyers is 1.2425 structure resistance based on 618 retracement of a major leg.

GBPUSD May Keep Growing Next Week!
GBPUSD is trading within a rising parallel channel.
Next week we can expect a bullish continuation from its support.
The next goal for buyers is 1.2425 structure resistance based on 618 retracement of a major leg.

Will THE BILL kill the Dollar???
Quadrillion salvatory bill will definitely affect the USD strength.
Even these last weeks we see a weakness of greenback versus major currencies.
so the question arises:
may the pumping kill the currency?
may it devalue so much so even the average Joes notice that?
with technicals, on focus is a major rising channel.
after a long consolidation in a bearish triangle, the price is now attempting to break below that.
then it will face with the major support.
it will be a truly decision moment for USD.
with fundamentals, we are bearish biased and preparing for a breakout!
but who knows?
orange man can change everything.
what do you think will happen?

U.S Dollar Index (DXY) Bearish View by ThinkingAntsOk🔸 4H CHART EXPLANATION:
.
.
🔸 Price is moving on a range.
.
🔸 At this moment, it is facing the Ascending Trendline of the consolidation.
.
🔸 If it is broken, then it has potential to reach the Support Zone.
.
🔸 Will look for a lower timeframe bearish setup once the direction is confirmed.
🔸 DAILY CHART ANALYSIS:

GBPUSD 27.05.2020Hello traders,
I see the price retracing to the area where yesterday I said that it could bounce back up. If this level holds the bearish pressure GBP/USD pair will head towards the inter-range resistance.
Wish you all a great day and be safe !

USDCAD: Important Breakout Attempt!!!
Cad is breaking below a key daily structure.
What to expect and how to trade?
Potential scenarios and key levels explained.

NZDUSD: Strong Resistance Ahead!
NZDUSD is entering a key supply zone 0.62 - 0.626.
the zone is based on a horizontal 3 days, daily structure, and a rising resistance line of a triangle.
be prepared for the bearish reaction from the underlined area.

NZDUSD: Bearish Forecast
NZDUSD is on a daily/4H structure resistance.
the price has formed multiple lower highs on 1H confirming the significance of the underlined structure.
also, 0.6105 minor support was broken this morning.
based on that I expect a further decline on NZDUSD.
target levels for today:
0.6073
0.6043

GOLD (XAUUSD) Multi Time Frame Analysis & Trading Plan
hey guys,
a lot of questions about gold!
for now, I don't have any active trading position.
just recently the price reached a key daily support level.
what I like about that structure is that it matches perfectly with intraday structure and 382 retracement of the last impulse.
on focus now is 1H chart,
classic double bottom formation there.
I will buy the bullish breakout of 1740 minor structure resistance (1H candle close above) with targets: 1748.5/1758!
remember that this double bottom pattern can easily turn to the indecision range.
being broken to the downside, out setup will be invalid,
but I would not short, because too much structure lower!)
good luck!

GBPUSD: Breakout of Key Level & Bearish Continuation
hey traders,
what a short rally on GBPUSD on Friday!
the price has surely broken below a major daily structure support level.
now we will expect a further decline to the next major levels:
1.20 level is 2019's structure low and I truly believe that it is the current goal for sellers.
1.19 level is 2016's structure low after brexit referendum/
pay close attention to these levels next week.
concerning trading recommendations, it is definitely too late to jump in.
the impulse is missed and it is very risky to short on current prices.
look for a pullback to a yesterday's broken structure to short.
good luck and have a great weekend!

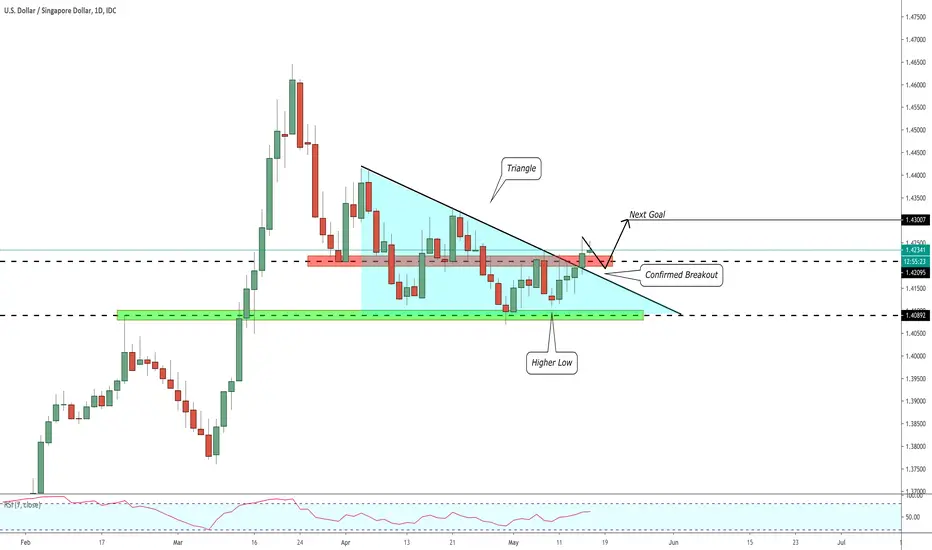
USDSGD Bullish Forecast!
usdsgd broke above a resistance line of a triangle on a daily.
the breakout is considered to be confirmed and now we expect a bullish continuation to the next structure resistance: 1.43 level.
The best trade entry is always on a pullback.
good luck!
EURUSD: Multi Time Frame Analysis & Two Scenarios Explained
morning guys,
EURUSD is consolidating on a strong daily structure and based on a current market sentiment we have two potential trading scenarios.
bullish:
I am still bullish biased and due to a nice convergence of a daily/1H support and a rising trendline I still believe that the price can bounce.
our trigger for long trade will be a double bottom formation on 1h,
the underlined minor horizontal resistance should be broken to the upside.
then buy entry on retest of the broken structure with initial target 1.084 / second target 1.0875
bearish:
however, a lot of news with fundamental statistics today, so the bearish scenario is highly possible as well.
daily candle close below the underlined structure will most likely signify a bearish continuation.
confirmed structure breakout will push the price to 1.069 - current daily lower close with a potential continuation to 1.064 - current low.
what do you think will happen?

USDCAD: Strong Resistance Ahead!
USDCAD is very close to a strong structure resistance.
1.413 - 1.4175 is the perfect potential reversal zone based on a horizontal structure and a falling trendline.
to confirm the significance of that zone we will be waiting for a breakout of the rising wedge pattern on 4H.
then we can short the pair aiming at 1.403 / 1.395
bias will switch to bullish in case of a bullish violation of the underlined structure.

USDCHF: Potential Harmonic Bat Pattern
potential harmonic bat pattern is forming on USDCHF!
0.961 - 0.959 is a safe area to buy from.
from that zone we will expect a bullish reaction to 0.9663/0.971 levels (382 and 618 retracement of AD leg)
safest stop 0.95666 (below structure)
good luck!

AUDUSD: Multi Time Frame Analysis & Trading Plan
hey guys,
AUDUSD is stranding on a key daily level 0.645.
the price is recovering after a drop from 0.656 but we are still looking for a short opportunity.
at the moment I am looking at price action on 1H chart:
the pair is currently forming the right shoulder of a head & shoulders pattern.
being formed, our call to action is the neckline breakout (1H candle close).
we short the market on a pullback and aim at: 0.638 / 0.633 levels.
in such trades, stop is always adjusted to the right shoulder and strictly set above that.
so if the right shoulder will be formed from a higher level, make the adjustment.
in case of a bullish continuation and violation of the head level setup will be invalid.
good luck!

DXY Weekly Upside is 101.17DXY Weekly Upside is 101.17
Upside target: 101.17
Floor price: 98.98
12:46:09 ( UTC )
Mon May 4, 2020
