The Meltdown of USDCAD, How Much Lower for the LoonieUSDCAD, Dollar Dumps, Bank of Canada Interest Rate Hikes. FOMC Tommorow and NFP Friday. How much Lower can the Dollar go?
US-DOLLAR


USDCAD Daily reviewThe US Dollar continued to be volatile against major currency. The currency is fluctuating based on the fundamental event happening in Davos. Technical indicator is trying relatively high to stop the movement of the currency.
By the middle Friday’s trading session, there was a spike in the USD/CAD pair because of US president speech in Davos. The combination of the 55—hour, 100—hour and 200—hour SMAs is proving resistance near the 1.2386 mark.
Regarding the short- term future, its is likely the fundamental events will drives the currency to be more volatile and is advice to stand aside and watch the movement.

NZDUSD possible longI would place a BUY LIMIT, on the horizontal line, price level 0.7336. I believe before the price goes up it should retrace back to the marked area which was previous resistance.

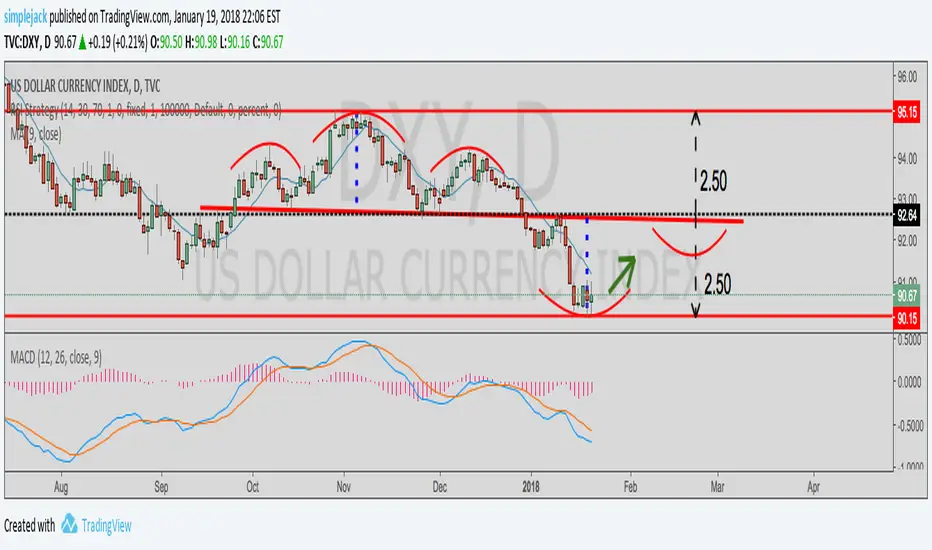
turkish lera still on weeknessturkish lira will go above 3.95 but needs some time until usd back to fly
jutt wait for a bottom 3.65-3.55
GLTA

Be careful shorting USD at this pointUS Dollar weekly chart i coming of a 6 year trendline. I see both Euro and Yen very resisted at this point. The euro zone has seen some improving economic news in the past months but with a still dovish central bank I'm not shure if the market will continue pushing higher at this time, give room for a dollar pullback or maby a move higher?
Im neutral at this point till trendline breaks or holds and pushes above 11 800 level.

USDCHF short, next structure @ .95000with same structure week before this pair broke bear flag in 4H time frame, minimum target of around .95800 to complete this structure with support and fib confluence is @.95000

US outperforms EU in absolute terms when $ rises against €Thesis: US markets outperform EU markets in absolute terms when $ rises against €.
EWG/SPY (Germany ETF/SPY both in $) vs EURUSD (red line)
I've read many opinions on what happens to US stocks (versus EU stocks) when the dollar rises. Usually people say a strong dollar is bad for US exporters as their revenues will fall and labour costs will rise. Similarly they say a weak euro is good for EU exporters as their foreign revenues rise and labour costs fall. And comparisons are often made between national indexes, which take no account of currency, and are thus pointless IMHO.
So this chart shows that the common sense view is completely wrong. It compares EWG (Germany ETF in US$) divided by SPY - which I'm using as a proxy for EU outperformance over US - and EURUSD. As you can see, they are very strongly correlated.
In other words when the $ started strengthening in 2008, the US indices started outperforming the EU indices. And in the previous cycle, when the dollar started weakening around 2002, and the euro strengthened, the EWG outperformed the SPY. And in the cycle before that, which ended around 2001/2003, € weakness again correlated very well with EWG weakness.

US DOLLAR INDEX -> 87.62 - 87.78 = TURNING POINT?Is it time for the US Dollar to start regaining its strength?
Strictly judging by my own technicals I'm seeing a potential reversal point around the 87.62-87.78 range where we see a strong confluence of a the 50.0% Fib retracement and 161.8% Fib extension.

Dollar Index - Kings Crown ??????The dollar index may find support at
1. Past horizontal resistance
2. 618 fib.
Price clearly is in the oversold region as per the stochastics.
The MACD may be tracing out bullish divergence .
These 4 indications could see price bounce from $ 88 , back towards the 200 period MAV.
Then the buck may slide all the way back to $ 79...

2018 is the year of GOLDXAUUSD has run well ahead of itself and is taking a breather! You may be able to take some profits shorting it, but it's very risky trading against the main trend upwards. Bounce against 1320 is going to signal an opportunity to buy and go long. Weakening DXY is going to continue keep the yellow metal rising and I see no reversal for either of these assets in 2018.


XrpUsd Are you still holding?My last post showed a short Bias due to news, with Korea and a lawsuit Ripples future looks like it has many challenges, but as it was stated before that the function of XRP is still very much worth the investment.
Thank you
Please leave a comment below
Expansion Team.

The deceptive US DollarThe DXY has found some support following a recent dramatic fall. This seems more like a retracement in a primary downtrend rather than a reversal and I wouldn't go long at this point unless:
1. it breaks through the major resistance line and stays above it AND
2. breaks through and stays above the supply zone

DXY-US government shutdown loomsSenate to Vote at 10 p.m. on Bill to Avert a Government Shutdown; Graham Proposes Three-Week Extension.
Break of support @ 90.00? Or H&S?
USDCAD set up to SellUSDCAD is moving in a primary downward direction and despite recent retracement is moving back to the demand zone. Past this area its further fall to the greenback.

USD/RUB 4H Chart: Continued to declined The US Dollar has continued to decline against the Russian ruble, as expected. The currency exchange rate has reached the previously set target of 56.13.
The target was chosen as it represents the low level of August 2017. Moreover, it consists of various other levels of significance. For example, an inverse Fibonacci retracement level of past high and low levels would be located at that level.
Meanwhile, regarding the long term, the movement is likely to continue south until it breached the monthly pivot point's support at 54.88.

USDCHF testing major support, prepare for a bounceBuy above 0.9569. Stop loss at 0.9501. Take profit at 0.9699.
Reason for the trading strategy (technically):
Price is testing major support at 0.9569 (ABC Fibonacci extension, 76.4% Fibonacci extension, horizontal swing low support) and we expect price to make a nice bounce above this level to push it up to at least 0.9699 resistance (Fibonacci retracement, horizontal pullback resistance).
Stochastic (34,5,3) is seeing major support above 5.8% where a corresponding bounce is expected.

USD - Double bottom Hi folks,
The USD posted a double bottom on the Daily Currency Barometer. This DOES NOT mean a reversal for the USD pairs. Not unless key price levels are breached. Look for consolidation patterns before the next push (USD sell-off). However, if key price levels fail, the USD Bulls could have their day for a bit. The only thing we know for sure at this moment: The USD needs to consolidate before another sell-off. Remember, consolidation does not mean 'pull-back'.
Don't bet on another long term USD sell-off until the currency has had time to consolidate.

NZD/USD daily reviewsAfter the plunging of the New Zealand Dollar against the US Dollar, which took place on Friday, the currency exchange rate suddenly recovered.
Moreover, by the middle of Monday’s trading session the currency pair had even surged to new high levels. At 12:00 GMT on Monday the pair had already almost touched the 0.73 mark.
In addition, the recent surge of the Kiwi against the Buck can be observed to have occurred in a narrow range short term ascending channel pattern. The pattern is likely going to guide the pair up to the resistance of the weekly R1, which is located at the 0.73 mark.

USD/CAD daily reviewsThe US Dollar stopped its depreciation against the Canadian Dollar on Monday. The reason for the stop of the surge and a resulted short term surge was the encountering of a combined support level at the 1.24 mark.
Namely, the currency exchange rate found support in the lower trend line of the drawn junior channel down pattern and the first weekly support at the already mentioned 1.24 level.
Due to that reason it is expected that the pair might surge until it meets the upper trend line of the channel down pattern. Afterwards the pair should continue the decline. Or the rebound might not even continue.

USD/CNH Long term The US Dollar has continued to lose ground against the rest of the currencies. The USD/CNH pair is no exception to this event. However, there is one interesting aspect to the decline of the Buck against the Chinese Yuan.
The currency pair recently stopped its decline and began to trade sideways. The move was initiated by a combined support of the lower trend line of junior channel down pattern, weekly S1 and monthly S2. All of these support levels are located in a range from 6.4200 to 6.4290.
Meanwhile, resistance is provided by the 61.80% Fibonacci retracement level at the 6.4480 mark.
The pair is likely to trade sideways until it reaches the resistance of the channel. Afterwards, the decline should resume.
