US

USDCHF: Breakout, Price Action & Market Reversal
Daily time frame analysis on USDCHF.
Trading recommendation & scenarios.
Price action & directional bias.
Please, support this idea with like and comment!

EURUSD: Where are We Going? Price Action Analysis
EURUSD is currently stuck within an expanding triangle formation on 4H.
Its lower boundary is based on a major horizontal daily/4h support.
Its upper boundary is based on a strong 4H rising trend line.
The breakout of its boundaries will clarify the future long term direction of the market.
If we see a bear breakout of horizontal support,
it will most likely lead to a start of a long term bearish trend on a pair.
If we see a bullish breakout of its trend line, bullish continuation will most likely follow.
For intraday trading, both boundaries can be considered.
Please, support this idea with like and comment. Thank you

SPX weakens at the start of Feb 21The SPX broke its daily uptrend since the 051120 at 3471 at Friday's close breaking the 3726 supertrend daily support. Shorts on the 4hr at managed to bring prices down below the SSSB line on the cloud closing at 3705.
Pivot 3828
Shorts below 3828 targeting 3539 and 3302
Long only if 3828 breaks above to retest 3863 to reclaim All time highs

2021: Hyper volatility expectedIn 2021 we should see massive moves not only in stock but also in forex as the US stock market is priced in US Dollars (88 percent of foreign exchange transactiosn globally).
Volatility equals economic instability. Get ready for the show! SPX Volatility Index (VIX) already set some records in January.
(VIX put in for an incredible run Wednesday. On a purely notional basis, the index charged over 60 percent higher this past session – the third biggest advance from the ‘fear index’ in its record.)
It is going to be interesting year!

EURUSD: Update & Technical Outlook
Daily/4h time frame analysis on EURUSD.
Price action & potential scenarios.
Trading recommendations.
Please, support this video with like and comment!

Super choppy few days. The Dollar is firmer across the board...Super choppy few days. The Dollar is
firmer across the board in the run up to the FOMC amidst little expectation of really anything major in terms of policy moves or fresh guidance beyond the inevitable updated assessment of the economic situation and outlook since the prior meeting, plus anything Fed chair Powell reveals in the press conference via text or during the Q&A (full preview of the event available in the Research Suite). However, durable goods in the interim often has the potential to surprise and could provide the Buck and index with another test of resilience after the latter extended its run of consecutive closes above 90.000 on Tuesday to 9 trading sessions, and just carved out a firmer 90.432 intraday high vs 90.119 at one stage, albeit with a big helping hand from the Euro.

AUDUSD: Major Reversal is Coming?! Learn How to Catch it:
Multi time frame analysis on AUDUSD.
Potential scenarios and bearish clues.
Trading recommendations.
Please, support this video with like and comment. Thank you

GBPUSD: Technical Analysis & Price Action
Daily/4h time frame analysis on GBPUSD.
Potential scenarios and trading recommendations.
Directional bias and reversal clues.
Please, support this video with like and comment. Thank you

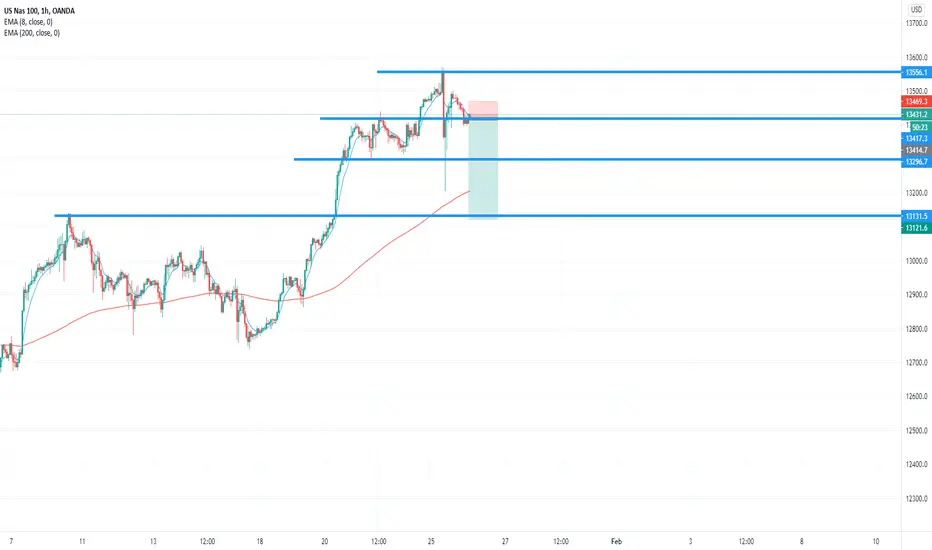
Sell opportunity for NAS100 valid through 1-28-2021Sell opportunity for NAS100 valid through 1-28-2021
USGOVT Curious index.
The S&P U.S. Government & Corporate Bond Index seeks to track the performance of U.S. dollar-denominated debt publicly issued in the U.S. domestic market, including U.S. Treasury, U.S. agency, and investment-grade corporate securities.
Sincerely L.E.D
In Spain on 01/24/2021

BULLISH,,,, BULLBACK we have clear good rejection by strong buyers we expecting they will push the price up to the value area after retesting the POC

USOIL Made a Double Top Pattern Price is in the correction phase, Double Top pattern has been created and the neckline was broken out to the downside. Price pulled back to it and now it seems like it is going to be dropped around the marked area. REMEMBER that the MAIN TREND is UPSIDE and IF price reached to that level, you can enter the long position in the future.

January 18 NASDAQ US100 Chart Analysis
Hello,
“Make it simple, make profit”
It’s BitcoinGuide.
Don’t forget to
“Follow” me and press “Likes”.
If you "follow" press,
In real time, you can check major sections and move,
Real-time "update I dea" can be checked.
I will begin NASDAQ ZeroMarket US100 Chart Analysis for January 18.
This is a 30 minute chart long position strategy.
Week Candle Chart MACD Dead Cross.
Danger signal disappears.
If it does not fall downward,
It's a short position, so it's not a profitable spot.
Therefore, I prepared a long position strategy.
The stop loss is very short.
*At the time of arrow move path, long position strategy.
(After that, when the red resistance line is break through, it is on the uptrend)
*When the sky blue finger moves path,
Long -> Short -> Long switching strategy.
(Check if it breaks through the green resistance line.)
The sky blue support line is a stop loss.
If Break away, along the green support line
It can fall.
Check the price, shown on the right.
Thank you for reading again today.


January 13 NASDAQ US100 Chart Analysis
Hello,
“Make it simple, make profit”
It’s BitcoinGuide.
Don’t forget to
“Follow” me and press “Likes”.
If you "follow" press,
In real time, you can check major sections and move,
Real-time "update I dea" can be checked.
I will begin NASDAQ ZeroMarket US100 Chart Analysis for January 13 .
This is a 30 minute chart short position strategy.
Today I tried to find the trick.
*Today, if the final green resistance line is break Through,
The trading strategy fails.
*When the arrow moves,
After attempting to break through the red resistance line
Short -> Long switching strategy.
*Sky blue finger, when moving path,
After touching the orange support line,
Short -> Long switching strategy.
When switching,
Separate each arrow section / light blue finger section.
Thank you.


That's how I see BTCUSD's next moveWhat's your thought of BTCUSD?
I think the uptrend will continue for a while.
it's just taking a breath to get ready and go up with even more power.

TESLA Hello receive a cordial greeting, and a thriving 2021 our wishes are that 2021 will be a fantastic year in all aspects for all people.
NOW : Elon Musk becomes world's richest person
TESLA BUBBLE ??
Receive a cordial greeting from L.E.D
In Spain on 01/08/2021

What about the DXY? Potential Retracement + ImpulseGood morning traders, today we bring you our analysis on the DXY index, along with an analysis of the potential behavior based on the short and long term zones.
🔸For most of 2020, the price was in a downtrend after bouncing off the Resistance Zone.
🔸The movement was so strong that it managed to penetrate the Bullish Channel that had been active for almost 10 years to the downside.
🔸At this time, the price is approaching the Support Zone, where we will most likely see a reaction/consolidation for a few days/weeks.
🔸If the price does not make a strong reversal, we may see a breakout to the downside of this correction.
🔸In case this happens, the next support area is around $80, which would imply an interesting price drop.

Fresh Supply Zone outside of Novice Space + Big profit margin.Low risk, high probability, high reward entry.

Gold - Taking a run at $2,000?Gold has had a great start to the year after enduring a difficult final few months of 2020.
The yellow metal smashed through $1,900 and hasn't looked back, seeing some resistance around $1,950 but not pulling back in any significant way.
The backdrop of a softer dollar is continuing to be supportive for gold, although that could be tested in the coming days depending on the outcome of the Senate re-run election in Georgia. Should the Democrats take effective control of the Senate, it could be bullish for the greenback and stall gold's progress.
From a technical perspective, gold is testing an interesting level around the 61.8% fib of the summer highs to November lows. This coincides roughly with the top of the rising channel on the four hour chart which could make it an interesting level of resistance in the near term.
A break above here could open the doors to a run at $2,000 which would be very interesting, indeed.

SPX bullish close for 2020The SPX closed bullish for all time frames including the monthly charts that leads the way for more gains into 2021. New all time highs are expected in the first trading week of 2021.
Short term Pivot is at 3725.
A break of 3725 will test 3653 and 3508
