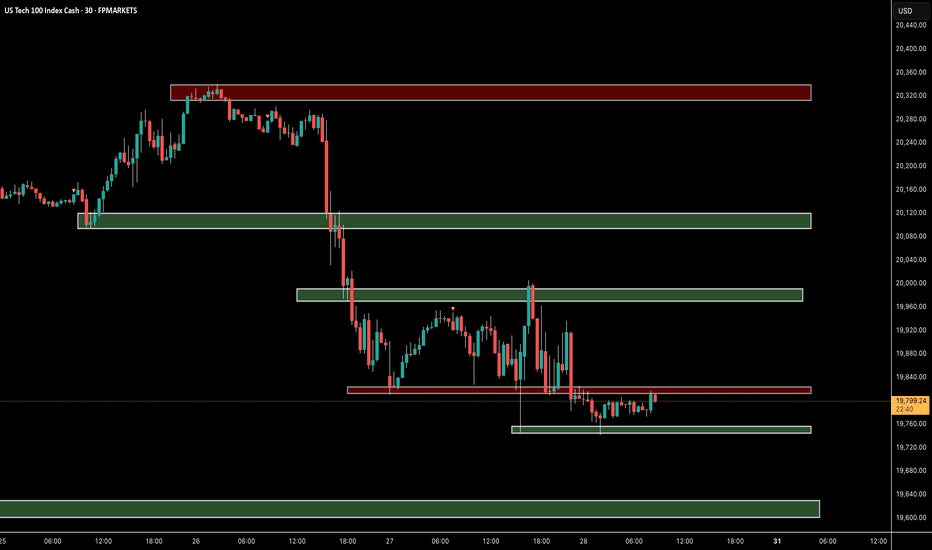
US100 BULLS ARE STRONG HERE|LONG
US100 SIGNAL
Trade Direction: long
Entry Level: 19,170.0
Target Level: 20,308.4
Stop Loss: 18,413.4
RISK PROFILE
Risk level: medium
Suggested risk: 1%
Timeframe: 9h
Disclosure: I am part of Trade Nation's Influencer program and receive a monthly fee for using their TradingView charts in my analysis.
✅LIKE AND COMMENT MY IDEAS✅
Us100
NAS100: Likely rebound at major point within Ascending ChannelCAPITALCOM:US100 is likely to be undergoing a corrective move as it tests the lower boundary of the ascending channel, as shown on my chart. This boundary serves as dynamic trendline support and a significant bullish reaction could happen if buyers step in at this level.
A successful rebound from this support could lead to a move toward the midline of the channel, with the next target at around 22,000 . This scenario would maintain the overall bullish trend structure.
However, a clear breakdown below the trendline support would weaken the bullish outlook and could lead to further downside.
Monitoring candlestick patterns and volume at this critical zone is essential for identifying buying opportunities. Proper risk management is advised, always confirm your setups and trade with solid risk management.
If you have any thoughts on this setup or additional insights, drop them in the comments!
NASDAQ Will the disappointing PCE today form a Double Bottom?Nasdaq is on a strong 3 day correction that has almost erased the recovery attempt since the March 11th low.
That was a higher Low inside the 8 month Channel Up and the current correction may be a bottom formation attempt like September 6th 2024.
Trading Plan:
1. Buy before the closing market price.
Targets:
1. 23350 (the 1.382 Fibonacci extension).
Tips:
1. The RSI (1d) illustrates the similarities with July-September 2024 in a much better way. Strong indication that the Channel Up is attempting to price a bottom.
Please like, follow and comment!!
Nasdaq100 Update: Another Leg Down Likely After Recent Reversal?For quite some time, I have been highlighting the possibility of a strong correction in the Nasdaq 100 ( TRADENATION:USTEC ), with the 17,500 level remaining a realistic downside target.
In my more recent analyses, I argued that while a reversal from the 19,100 support zone was likely, it was merely a dead cat bounce , and the index could decline further from the 20,300-20,500 resistance zone. The lower boundary of this range was tested, and as expected, the index has started to fall again.
Although a temporary rally above 20,000 cannot be ruled out, my overall outlook remains unchanged—I still anticipate another leg down.
In conclusion, selling into rallies continues to be my preferred strategy, with 17,500 as the medium-term target.
Disclosure: I am part of Trade Nation's Influencer program and receive a monthly fee for using their TradingView charts in my analyses and educational articles.
20323.3-20647.3 The key is whether it can rise above this level
Hello, traders.
If you "Follow", you can always get new information quickly.
Please also click "Boost".
Have a nice day today.
-------------------------------------
The April TradingView competition is sponsored by PEPPERSTONE.
Accordingly, we will look at the coins (tokens) and items that can be traded in the competition.
Let's talk about the NAS100 chart.
--------------------------------------
(NAS100 1M chart)
I think the stock market is fluctuating due to the rapidly changing situation and various economic issues.
Therefore, I think it is not easy to analyze index charts such as NAS100 and US30.
However, since the HA-High indicator of the current 1M chart is newly generated and is showing a downward trend, if it does not rise above 20647.3 when the competition starts, it is likely to eventually fall.
If it falls below the M-Signal indicator of the 1M chart, it is necessary to check for support near the Fibonacci ratio range of 0.5 (15898.2) ~ 0.618 (17130.8).
-
(1D chart)
The key is whether it can receive support near 19598.6, the HA-Low indicator point of the 1D chart, and rise above the M-Signal indicator of the 1W chart.
If not, it is expected that it will eventually meet the M-Signal indicator of the 1M chart and determine the trend again.
Currently, the price is being maintained above the M-Signal indicator of the 1M chart, so it is maintaining an upward trend in the medium to long term.
Therefore, when the competition starts, you should respond depending on whether the price is being maintained above or below the M-Signal indicator of the 1D chart.
Currently, the short-term support zone is 19269.9-19598.6, and the medium to long-term resistance zone is 20323.3-20647.3.
Even if it is supported and rises in the short-term support zone, if it fails to break through the medium to long-term resistance zone, it will eventually fall.
-
Thank you for reading to the end.
I hope you have a successful transaction.
--------------------------------------------------
NASDAQ INDEX (US100): Bullish Reversal Confirmed?!
I see 2 very strong bullish reversal confirmation on US100 on a daily.
First the market violated a resistance line of a falling channel.
Then, a neckline of a cup & handle pattern was broken.
Both breakouts indicate the strength of the buyers.
We can expect a growth at least to 20300 resistance.
❤️Please, support my work with like, thank you!❤️
US100 NASDAQ100 Long Market turns!U.S. stocks ended higher on Tuesday on optimism that President Donald Trump’s reciprocal tariffs, which go into effect from April 2, will be less aggressive than previously expected
Therefor as traders we are very flexible and have to react fast,because a lot of people say a lot of things, and that makes the markest move faster and turning back more quickly.
Also its essential to take profits immediately as the markets move fast and turning, before giving that money gained back to the market.
Below the red line Bearish setups.
Rockets:Conservative(near of support) AND AGGRESSIVE ENTRIES.
Risk and money management is essential.Think about your stops!
US100 - Bullish Continuation Inside Ascending ChannelThis TradingView post showcases a technical analysis of the US100 (Nasdaq 100 Index) on the 4-hour timeframe. The chart highlights a well-defined ascending channel, reflecting the current bullish structure. Price action is seen retracing after touching the upper boundary of the channel, moving towards a key region of interest labeled as "IFVG" (Imbalance Fair Value Gap), where potential demand is expected.
The analysis predicts a retracement to the 0.618–0.65 Fibonacci retracement zone, aligning with a confluence of support levels within the channel. A potential bullish reversal is anticipated at this level, aiming for a continuation towards new highs near the upper boundary of the channel. The green projection line illustrates the anticipated path of price action.
This setup combines channel dynamics, Fibonacci levels, and market structure concepts to identify a favorable trade opportunity.
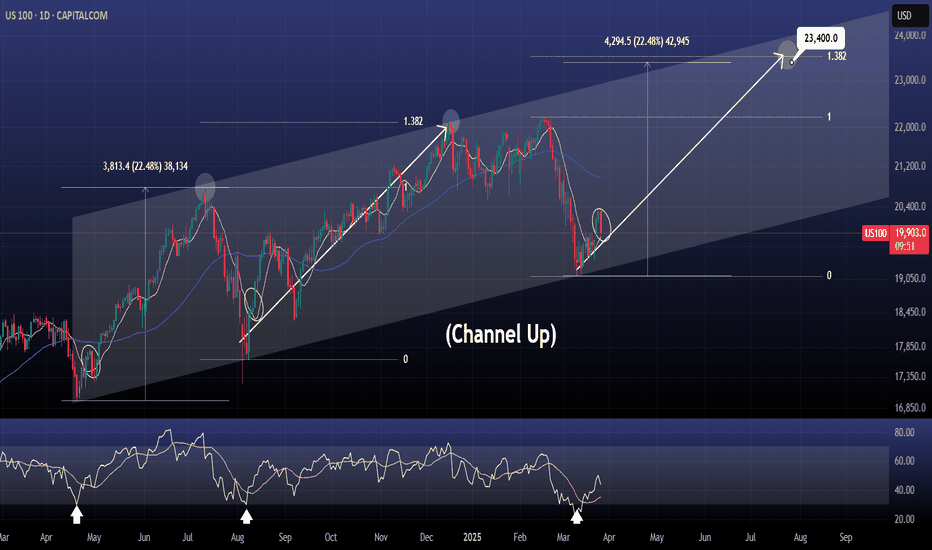
NASDAQ on the first minor pullback of the new bullish wave.Nasdaq / US100 has just started the new bullish wave of the long term Channel Up.
The bottom was made 2 weeks ago and every time the bullish wave crossed over its 4hour MA50, it is expected to make a pullback retest at some point.
This pullback is taking place today.
Whether it replicates the first bullish wave of the Channel Up or the second, the index aims for either a 22.48% total rise or the 1.382 Fibonacci extension.
Both happen to be around the same level.
Buy and target a little under them at 23400.
Previous chart:
Follow us, like the idea and leave a comment below!!
NAS100 Price ActionHey traders!
Looking at the current market structure, we can see that the price failed to make a new higher high , which is often the first sign of a potential trend reversal. This was followed by a break of two key structure levels, confirming a shift in momentum from bullish to bearish.
Interestingly, a supply zone was formed during this shift, but price didn’t even retest it — instead, it dropped right after its creation, showing strong bearish pressure. There's also an internal candle (IFC) marking the transition point.
With this kind of price action, it’s likely that the market is heading toward the next demand zone below. This could present a solid short opportunity, but always remember to manage your risk wisely and wait for clean confirmations.
NASDAQ: Short term Channel Up on critical Resistance.Nasdaq is neutral on its 1D technical outlook (RSI = 49.418, MACD = -276.610, ADX = 37.535) as it has recovered from the oversold state of 2 weeks ago. By doing so, it has formed a Channel Up on the 1H timeframe but as the price hit its top and the 1H RSI has formed a bearish divergence like the previous HH, it is possible to see a quick pullback. As long as the price stays inside the Channel Up, target the 1H MA200 (TP = 19,900). If it crosses above the top of the Channel Up, buy and target the R1 level (TP = 20,650).
## If you like our free content follow our profile to get more daily ideas. ##
## Comments and likes are greatly appreciated. ##
US100 Short Fear rises of FED possible ,,No-Rates Cut,,!wE CAN SIMPLY TELL THE SAME REASON trading stocks,indices! Simple: Economy under big inflation pressure.
2 approaches:Conservative and agressive entry. Where breakout traders enter,where others put their takeprofits,where others put stops: Thats my entry.Simple.
Near details ,please take a look at the chart above
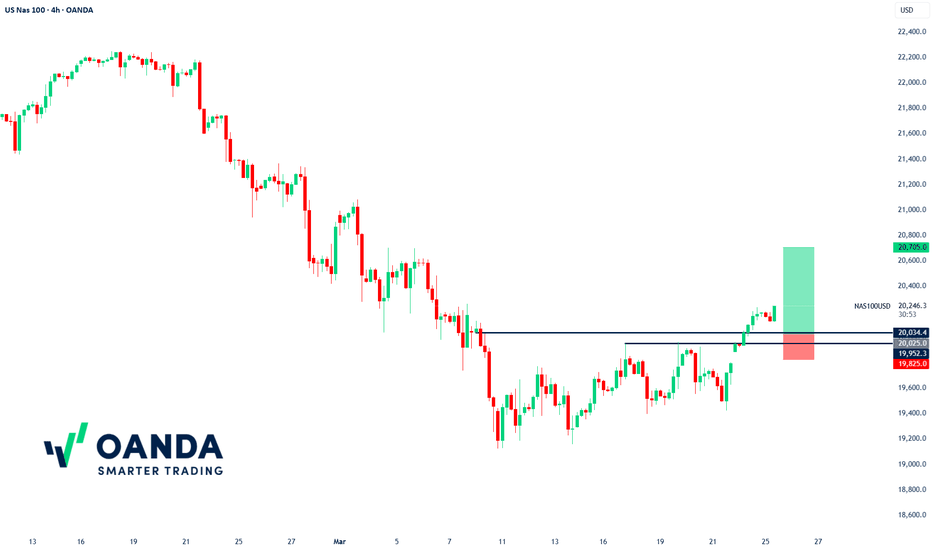
NAS100USD Buy Idea: Bullish Momentum Targets 20705🚀 OANDA:NAS100USD Buy Idea: Bullish Momentum Targets 20705 💹 - 24h expiry
OANDA:NAS100USD - We look to Buy at 20025
Stop Loss: 19825
Target 1: 20705
Target 2: 20730
Resistance: 20234, 20705, 20730
Support: 20025, 19423, 19125
Technical Setup:
📈 Continued upward momentum from 19424 resulted in the pair posting net daily gains yesterday .
⚠️ Overbought extremes indicate scope for mild selling at the open, but losses should remain limited .
🔑 Medium-term bias remains bullish .
🏁 Key resistance level at 20705 .
📰 News Sentiment
📊 Recent sessions show a bullish uptick in News Sentiment (Red Line), aligning with the price movement (Blue Line).
🌟 Positive sentiment (Red Line) is extending higher, suggesting further upside potential in the short term.
Risk Disclaimer
The trade ideas beyond this page are for informational purposes only and do not constitute investment advice or a solicitation to trade. This information is provided by Signal Centre, a third-party unaffiliated with OANDA, and is intended for general circulation only. OANDA does not guarantee the accuracy of this information and assumes no responsibilities for the information provided by the third party. The information does not take into account the specific investment objectives, financial situation, or particular needs of any particular person. You should take into account your specific investment objectives, financial situation, and particular needs before making a commitment to trade, including seeking advice from an independent financial adviser regarding the suitability of the investment, under a separate engagement, as you deem fit.
You accept that you assume all risks in independently viewing the contents and selecting a chosen strategy.
Where the research is distributed in Singapore to a person who is not an Accredited Investor, Expert Investor or an Institutional Investor, Oanda Asia Pacific Pte Ltd (“OAP“) accepts legal responsibility for the contents of the report to such persons only to the extent required by law. Singapore customers should contact OAP at 6579 8289 for matters arising from, or in connection with, the information/research distributed.
Will NASDAQ Rally Continue? Technical Analysis & Trade Idea.NASDAQ NAS100 (4H Chart) Analysis 📊📈
The NASDAQ NAS100 is showing strong bullish momentum on the 4-hour chart. The chart suggests a continuation of the uptrend, with a potential move toward the 21,013.0 target. 🚀
Key Levels to Watch 👀
Support Levels:
19,750.9: Near the 61.8% Fibonacci retracement, this level has seen strong buying interest.
19,405.8: The 100% Fibonacci retracement, marking the swing low and a critical support zone.
Resistance Levels:
20,209.4: The 0% Fibonacci retracement, acting as immediate resistance.
20,611.2: The 50% Fibonacci extension, a key target for bullish continuation.
21,013.0: The 100% Fibonacci extension, representing the ultimate bullish target in this trend.
Volume Profile Insights 📉
The Volume Profile shows heavy trading activity between 19,800–20,000, confirming strong support in this range. Above 20,200, trading volume thins out, suggesting that a breakout could lead to a quick rally toward 21,000.
Momentum and Indicators ⚡
Trend: The index is in a clear uptrend, forming higher highs and higher lows since the recent swing low.
Fibonacci Confluence: The alignment of the 50% retracement and Volume Profile support strengthens the bullish outlook.
Curved Arrow Projection: A pullback to the 19,800–19,750 zone is likely before the next leg higher toward 21,013.0.
Social Media Sentiment 🌐
Twitter: Analysts are optimistic, citing strong tech sector performance and easing interest rate fears. Many traders are eyeing the 21,000 level as the next milestone.
Reddit: Discussions emphasize the importance of the 19,800 support zone, warning that a break below this level could invalidate the bullish setup.
Conclusion 📝
The NASDAQ NAS100 is set for a bullish continuation, with key support at 19,750–19,800 and resistance at 20,209.4 and 21,013.0. Watch for a potential pullback to the 50% Fibonacci retracement before the next upward move. A break below 19,750 could signal a shift in momentum, while a breakout above 20,209.4 would confirm the bullish trend. 🚀
Disclaimer: This analysis is for informational purposes only and not financial advice. Always do your own research and consult a professional before trading. 📢
NASDAQ The recovery has officially started.Nasdaq (NDX) has been trading within a 2-year Channel Up and with today's opening, it broke above the Lower Highs trend-line of February's Bearish Leg. Even though the confirmed bullish reversal signal technically comes above the 1D MA50 (blue trend-line), we already have the early bottom signals.
First and foremost, the 1D RSI rebounding from the same oversold (<30.00) level where all major Higher Lows of the Channel Up did (August 05 2024, April 19 2024, October 26 2023). Every time the price reached its -0.5 Fibonacci extensions following such bottoms. Also each Bullish Leg tends so far to be smaller than the previous.
As a result, targeting a +24% rise (-3% less than the previous Bullish Leg) at 23500 is a very realistic Target technically, as it is considerably below the -0.5 Fibonacci extension.
-------------------------------------------------------------------------------
** Please LIKE 👍, FOLLOW ✅, SHARE 🙌 and COMMENT ✍ if you enjoy this idea! Also share your ideas and charts in the comments section below! This is best way to keep it relevant, support us, keep the content here free and allow the idea to reach as many people as possible. **
-------------------------------------------------------------------------------
💸💸💸💸💸💸
👇 👇 👇 👇 👇 👇
US100 SENDS CLEAR BEARISH SIGNALS|SHORT
US100 SIGNAL
Trade Direction: short
Entry Level: 19,765.3
Target Level: 19,601.3
Stop Loss: 19,874.3
RISK PROFILE
Risk level: medium
Suggested risk: 1%
Timeframe: 1h
Disclosure: I am part of Trade Nation's Influencer program and receive a monthly fee for using their TradingView charts in my analysis.
✅LIKE AND COMMENT MY IDEAS✅
Bearish Alert: Nasdaq’s Downtrend May Deepen Beyond 5%Hey Realistic Traders, Will CAPITALCOM:US100 Bearish Trend Stop? Let’s Dive In....
On the H4 timeframe, Nasdaq continues to follow the bearish trendline and the EMA-200 . Both trend analysis tools clearly signal a bearish trend. The downtrend may persist as a rising wedge pattern has formed, followed by a breakout and a MACD crossover.
Based on these technical signals, I anticipate a potential downward movement toward the first target at 19,077. After reaching this level, a minor pullback is likely before the decline continues toward a new low at 18,544.
This outlook remains valid as long as the price move below the stop-loss level at 20,080
Besides technical factors, U.S. President Donald Trump still intends to implement new reciprocal tariff rates on April 2, adding further uncertainty to the market. This could limit growth potential and contribute to an inflationary environment by increasing the cost of imported goods. Given this uncertainty, we believe the market will continue to decline.
Support the channel by engaging with the content, using the rocket button, and sharing your opinions in the comments below.
Disclaimer: "Please note that this analysis is solely for educational purposes and should not be considered a recommendation to take a long or short position on Nasdaq.


