Bitcoin Bounced Right Where It ShouldBitcoin continues to respect the script — breakout, clean retest, and now holding strong.
The 50 EMA has been a reliable dynamic support throughout the entire uptrend, and once again, it helped catch the recent dip. Price has now successfully retested the breakout zone and is starting to bounce.
Structure looks healthy, momentum is building, and unless the support fails, the next leg up could be just around the corner.
Simple setups. No noise. Just trend.
DYOR, NFA
Us100

BTC - Will the Bears finally get their chance?Buy Side Liquidity Sweep in Progress
Price is currently climbing toward a region densely packed with resting buy side liquidity, marked by multiple previous highs. The area around 108,900 to 111,000 is especially significant, with two clear liquidity pools stacked above recent swing highs. These levels are likely to attract price as market participants seek to trigger stop orders and induce fresh buying interest—setting the stage for a potential reversal.
Weakness in the Current Impulse
The recent rally has advanced with minimal retracement and virtually no visible Gaps. This lack of corrective structure often indicates imbalance and suggests the move is overextended. When price moves upward too cleanly, it tends to leave behind thin liquidity zones, making the entire leg vulnerable to a sharper correction once exhaustion sets in.
Fair Value Gap as a Draw Below
Below current price lies a prominent bullish Fair Value Gap around 104,000. This inefficiency was left unfilled during the last leg up and may now serve as a magnet for price. These types of Gaps are often revisited by the market in an effort to rebalance supply and demand, especially after aggressive moves that break structure to the upside.
Once the higher liquidity levels are swept, watch for a clear reaction—either a strong rejection or lower timeframe structure shift—which could signal that the top is in. If that shift materializes, price may begin a downward leg targeting the unfilled Gap below. The magnitude of the move, combined with the lack of structure on the way up, leaves plenty of room for corrective action.
For those looking to engage, waiting for confirmation on a lower timeframe—such as a break of short-term bullish structure or the formation of a bearish Gap—can help time entries more precisely. In setups like these, patience is key: let the Sweep play out, observe how price reacts, and only then consider stepping in.

US100 BEARISH BIAS RIGHT NOW| SHORT
US100 SIGNAL
Trade Direction: short
Entry Level: 22,518.7
Target Level: 21,870.2
Stop Loss: 22,949.8
RISK PROFILE
Risk level: medium
Suggested risk: 1%
Timeframe: 9h
Disclosure: I am part of Trade Nation's Influencer program and receive a monthly fee for using their TradingView charts in my analysis.
✅LIKE AND COMMENT MY IDEAS✅

Smart Friday Trades: NASDAQ Setup and Key Levels to Watch NAS100📊 NASDAQ US100 Analysis – Friday Setup
I'm currently watching the NASDAQ closely 👀. The NAS100 looks significantly overextended 📈, and with it being the end of the week, we often see price action push into the weekly high before pulling back into the weekly close 🔁.
This is a pattern I’ve seen play out many times during the New York session on Fridays 🗽📉.
💡 Here’s my suggestion:
Wait for today’s data release 📅 to finish. If price ranges and then breaks market structure to the downside, keep an eye out for a short entry on the retrace and retest of the range low.
🎯 Your targets and stop loss are outlined clearly in the video, so make sure to watch it through.
⚠️ Trade sensibly, manage your risk, and don't rush into anything.
I'd love to hear your thoughts in the comments 💬
Have an awesome day and I’ll see you in the next one! 🚀

BTC - Double Top after Liquidity Sweep?Price has recently executed a Buy Side Liquidity Sweep just above the previous high. This type of move often signals a potential shift in market direction, especially when followed by signs of exhaustion or failure to push higher. In this case, price has formed a double top near the 106,600 level, a classic sign of weakening bullish momentum and hesitation at a key resistance area.
Following the Sweep, the projection suggests a possible rejection from this region, leading to a corrective move to rebalance the inefficiencies left behind by the sharp upward impulse. These inefficiencies are marked as Fair Value Gaps —areas where price moved too quickly, leaving imbalanced zones between buyers and sellers. The market tends to return to these areas over time as it seeks equilibrium.
The first Gap lies just below the 0.28 Fibonacci retracement and may serve as an initial area for a reaction. If price slices through this level without meaningful support, attention shifts to the second Gap, which aligns closely with the 0.50 to 0.618 retracement zone. This region is historically significant for pullbacks and could offer a temporary pause or bounce.
Should the move extend further, the third and deepest Gap, located between the 0.618 and 0.65 levels , becomes a key area of interest. It marks a critical rebalancing zone that could attract stronger buying interest. If this area fails to hold, the 0.786 retracement level sits just below and may act as a final point for support before any broader directional change.
For refined entries, traders can watch lower timeframes like the 5-minute chart. Look for signs of weakness, such as an inverted Gap or a lower-timeframe break in structure, to time positions with tighter risk. This allows participation in the broader move while maintaining tactical precision.
The confluence of a Buy Side Liquidity Sweep, a double top , and multiple Gaps below provides a clear framework for a potential downside play. As always, let the price action lead.
Patience, confirmation, and context are key to executing with confidence.

DOW JONES INDEX (US30): Consolidation is Over
Dow Jones Index completed a bullish accumulation on a daily.
The price violated a key horizontal resistance cluster and closed above that.
Next goal for bulls is 43790.
❤️Please, support my work with like, thank you!❤️
I am part of Trade Nation's Influencer program and receive a monthly fee for using their TradingView charts in my analysis.

US100 BULLISH BREAKOUT|LONG|
✅US100 is going up
Now and the index made a bullish
Breakout of the key horizontal
Level of 22,222 and the breakout
Is confirmed so we are bullish
Biased and we will be expecting
A further bullish move up
LONG🚀
✅Like and subscribe to never miss a new idea!✅
Disclosure: I am part of Trade Nation's Influencer program and receive a monthly fee for using their TradingView charts in my analysis.

US100 - Liquidity sweep above the ATHIntroduction
The US100 has been exhibiting a strong upward trend on the daily timeframe ever since the sharp correction in early April. This sustained bullish momentum culminated in a break above the previous all-time high (ATH) earlier today. However, this breakout may not be entirely convincing just yet, as there are signs of a potential short-term reversal. The move above the ATH could represent a liquidity sweep, where price action briefly pushes past a key level before retracing, possibly trapping late buyers.
Liquidity Sweep
On the daily chart, the US100 did succeed in breaching the previous ATH, but the breakout appears to have been short-lived. Price quickly reversed after the new high was printed, leaving behind only a wick above the ATH. This type of price action forms what is commonly referred to as a swing failure pattern, a scenario where the market tests liquidity above a key level before turning back down. Such a pattern often signals upcoming weakness, especially when the breakout lacks strong follow-through or volume support.
4H Fair Value Gap (FVG)
During the most recent leg up, the US100 left behind an unfilled fair value gap (FVG) on the 4-hour timeframe. This imbalance zone, created when price moves too quickly in one direction without enough time for buyers and sellers to match orders evenly, often acts as a magnet for price to return to. In the context of the current market structure, this 4H FVG could provide a meaningful support level if the index does experience a pullback. Should the index find support here and show signs of renewed buying interest, the broader uptrend is likely to continue. However, if this zone fails to hold, we may see a deeper retracement toward lower support levels.
Conclusion
While the US100 remains in a strong and well-defined uptrend on the higher timeframes, the recent price action above the ATH introduces the possibility of a short-term pullback. The appearance of a swing failure pattern and the presence of an untested 4H FVG suggest that some corrective movement could unfold in the near term. That said, the FVG presents a key area to watch for bullish continuation. If buyers step in at this imbalance zone, the index could resume its upward trajectory, reaffirming the strength of the current trend.
Disclosure: I am part of Trade Nation's Influencer program and receive a monthly fee for using their TradingView charts in my analysis.
Thanks for your support.
- Make sure to follow me so you don't miss out on the next analysis!
- Drop a like and leave a comment!

NASDAQ: Short-lived pullback ahead of major breakout.Nasdaq has entered strong bullish territory on its 1D technical outlook (RSI = 66.290, MACD = 331.080, ADX = 18.600). Despite that, it remains inside a slow moving Channel Up for the past month in contrast to the more aggressive bullish waves of the Channel Up in April and May. The 4H RSI peak may be similar to May 12th and April 24th. We believe that at least a +9.69% rally will emerge to approach the top of this 3 month Channel Up. Stay bullish, TP = 23,400.
## If you like our free content follow our profile to get more daily ideas. ##
## Comments and likes are greatly appreciated. ##

Market Structure Breakdown on NASDAQ: What Traders Should Watch📉 NASDAQ (NAS100, US100) Analysis 🧠💼
I’m currently keeping a close eye on the NASDAQ (NAS100) — price action is telling a story worth watching.
📆 Last week, the index came under clear pressure, and now on the 4H timeframe, we’re seeing a defined bearish structure with consistent lower highs and lower lows 📉🔻. This recent expansion to the downside has led to a break in market structure (BOS), and price is now pulling back into equilibrium 🔄.
⏳ For now, it’s a waiting game. I’m watching to see if this pullback finds resistance at a premium level and rotates back to the downside, which would present a potential short setup 🎯📊.
🕒 On the 30-minute chart, I’m monitoring for a clear structural shift — a change in momentum that confirms bearish intent. Should the NASDAQ resume its downward move, it could trigger risk-off sentiment, bringing strength into the JPY pairs 💴🚨 as capital flows out of risk assets.
⚠️ Disclaimer:
This analysis is for educational purposes only and should not be considered financial advice. Always conduct your own research and consult with a licensed financial advisor before making any trading decisions. 📚💼

NASDAQ Will the 4H MA200 support the Channel Up?Nasdaq (NDX) has been trading within a Channel Up since mid-May and today almost touched the pattern's bottom, making a Higher Low. At the same time, the 4H MA200 (orange trend-line) is right below it, the medium-term's natural Support.
Since the 4H RSI also bounced on the 32.20 Support, which is where the pattern bottomed on May 23, we expect the new Bullish Leg to start, as long as of course the 4H MA200 holds. The Target is the 1.382 Fibonacci extension at 22300.
-------------------------------------------------------------------------------
** Please LIKE 👍, FOLLOW ✅, SHARE 🙌 and COMMENT ✍ if you enjoy this idea! Also share your ideas and charts in the comments section below! This is best way to keep it relevant, support us, keep the content here free and allow the idea to reach as many people as possible. **
-------------------------------------------------------------------------------
Disclosure: I am part of Trade Nation's Influencer program and receive a monthly fee for using their TradingView charts in my analysis.
💸💸💸💸💸💸
👇 👇 👇 👇 👇 👇

NAS100 - Will the stock market continue to rise?!The index is trading in its short-term descending channel on the four-hour timeframe between EMA200 and EMA50. If there is no re-up and the channel is broken, I expect a correction to form, the target of which can be the bottom of the descending channel.
If the channel top is broken, we can expect a new ATH to be recorded in the Nasdaq index. It is better to wait for confirmation in case of a breakdown in order to control the risk further.
Over the past week, the Nasdaq has managed to stay within a stable range, especially despite geopolitical pressures, mixed signals from the Federal Reserve, and some concerns in the semiconductor sector. This stability is largely due to the strong fundamentals of large technology companies, the reduction in distribution days (selling pressure) in the market, and renewed expectations of interest rate cuts later in the year.
At a structural level, the number of distribution days, which indicate selling pressure from large institutions, has reached a relatively low number of 3 days in the Nasdaq over the past month. This is a sign of the weakness of heavy selling at price peaks and the market's willingness to maintain long positions. Unlike trends seen in previous years, this time the market has shown no signs of widespread divergence or fundamental weakness, even despite strong inflation data or concerns about new trade restrictions with China.
This trend is largely supported by the stellar performance of companies such as Nvidia, Microsoft, Apple and other major players in the artificial intelligence and technology sectors. Revenue growth, increased investment in AI infrastructure, as well as the return of institutional investors’ confidence in technology stocks, have led the Nasdaq to record significant returns since the beginning of 2025. Analysts from major financial institutions such as Goldman Sachs and Morgan Stanley, while warning of potential selling pressure on the index, remain positive about continued growth, of course, assuming that economic data does not deviate from the expected path.
However, some risks are clearly visible in the trading week ahead. The most important of them is the possibility of geopolitical tensions again affecting the market. In recent days, oil prices have risen and financial markets have experienced moments of fear after tensions in the Middle East escalated and the US political response to Iran and Israel's moves. Although the Nasdaq was able to withstand these fluctuations, the market remains very sensitive to energy price spikes and their impact on inflation.
Important data in the coming week could also determine the market's direction. The release of the Core PCE index, the Fed's preferred inflation measure, as well as data on unemployment insurance claims, both play a key role in the interest rate outlook. If inflation data is lower than expected, the likelihood that the Fed will start cutting rates in September or November increases, which would be a bullish stimulus for the stock market and especially the Nasdaq.
On the other hand, potential pressure on the semiconductor group - especially if new restrictions on technology exports to China are imposed - could disrupt the market trend. Last Friday, just one news report on the possibility of restricting exports of advanced chipsets caused the Nasdaq to fall by more than 0.6%. If this trend becomes official US government policy, it could cause a correction in stocks of companies such as Nvidia, AMD and ASML, which are heavy weights in the Nasdaq index.
In addition to these factors, next week will also see the release of quarterly reports from major companies such as Micron, FedEx and Nike. The results of these reports, especially in the area of sales and cost forecasts, could affect economic growth expectations. If the figures are better than expected, the Nasdaq could move towards new highs. However, if the data is released, the market could enter a short-term correction phase.
In terms of correlation with monetary policy, the Nasdaq index has become more sensitive than ever to interest rates and cash flows. The dollar price, real interest rates, and the direction of Treasury bonds all now have a direct impact on the valuation of technology companies. As a result, any change in the path of monetary tightening or easing is immediately reflected in the Nasdaq’s performance. However, analysts believe that the market will remain in a “wait and see” phase until the official data is released in July. In summary, the Nasdaq index is currently in a situation where its fundamentals are supported by the profitability of large technology companies, the easing of institutional selling pressure, and the possibility of a rate cut. At the same time, the market remains highly sensitive to major geopolitical news, trade policy, and economic data. As a result, the week ahead can be considered a “two-sided” period, where opportunities and threats are in a delicate balance, and only economic data and quarterly results can tip the balance in the direction of an increase or a correction.

NASDAQ Bullish Play into Liquidity Before Potential ReversalForecast:
NOTE: At this moment, this is a forecast and trades will be taken dependent on live PA.
Price has reacted strongly off the 21,410–21,430 Daily Order Block, suggesting bullish intent. If bullish structure holds, I expect a move into the 22,060–22,130 liquidity zone, where sell-side setups could form.
This is a classic Buy to Sell model:
Buy from OB at ~21,420
Target liquidity above recent highs (~22,100+)
Look for shorts after sweep into 22,130–22,220 range
Invalidation: Break and close below 21,410 suggests the OB failed — potential deeper drop toward 20,700.

NASDAQ Long-term looks brighter than ever!Nasdaq (NDX) has been trading within a massive Channel Up since the bottom of the 2008 U.S. Housing Crisis and during the April 07 2025 bottom, a very distinct bullish signal emerged.
The index hit its 3W MA50 (blue trend-line) for the first time since May 2023. As you can see, since the 2008 Crisis, every time the market rebounded after hitting the 3W MA50, it posted a rise of at least +62.06% before the next time it touched it (and that was on the highly irregular COVID crash).
As a result, we expect to see NDX hit at least 26500 (+62.06%) before a new 3W MA50 test. Chances are we see the market move much higher though.
Note also the incredible bounce it made on the 3W RSI 14-year Support Zone.
-------------------------------------------------------------------------------
** Please LIKE 👍, FOLLOW ✅, SHARE 🙌 and COMMENT ✍ if you enjoy this idea! Also share your ideas and charts in the comments section below! This is best way to keep it relevant, support us, keep the content here free and allow the idea to reach as many people as possible. **
-------------------------------------------------------------------------------
💸💸💸💸💸💸
👇 👇 👇 👇 👇 👇

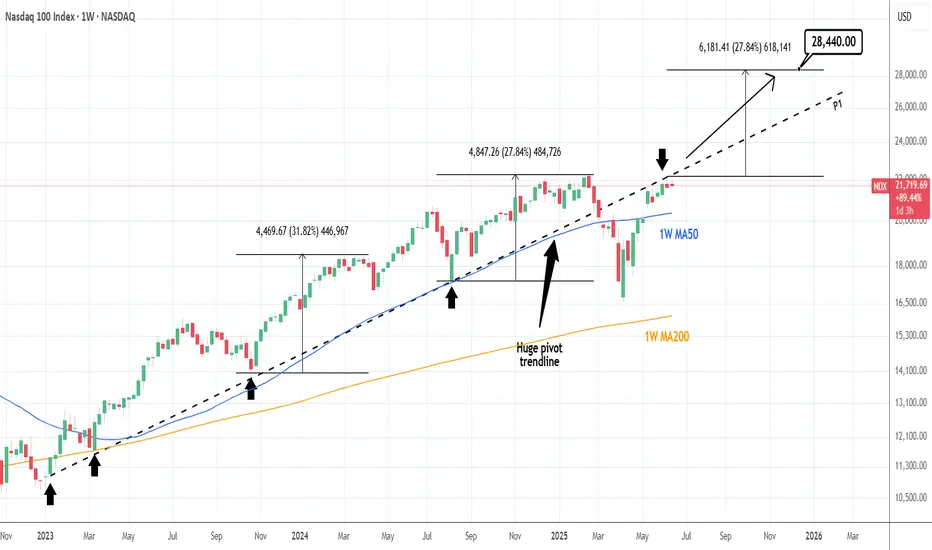
NASDAQ: Huge pivot can catapult it if broken.Nasdaq has turned neutral again on its 1D technical outlook (RSI = 54.712, MACD = 377..560, ADX = 20.644) as it has been struggling to cross above a hidden trendline, the Pivot P1 that was at the start of this Bull Cycle a support and after the trade war acts now as a resistance. If broken, we anticipate a +27.84% rise at least (TP = 28,440), which may very well be an end of year target.
## If you like our free content follow our profile to get more daily ideas. ##
## Comments and likes are greatly appreciated. ##

Nas100 target reached.I uploaded a trade idea of this yesterday and these are the results, I used proper risk management and proper execution approach!

Nasdaq 100 Trade idea for the day and bias.This is what I'm expecting Nas100 to do today looking at the higher timeframe structure.

NAS100 (US100) Mid Week Reversal - Bullish Order FlowA Half Batman presents itself during the Asian session and seems to be ready for LDN opening. This Peak Formation could be seen as the reset, to turn NAS100 bullish and ready to break the structure high.

NASDAQ Consolidation: Why Sitting Out Is Sometimes the Best PlayI'm currently monitoring the NASDAQ (US100) closely, and on the 4-hour chart, we can clearly see that the market is in a phase of consolidation 🔍
Yesterday, I was anticipating a bullish breakout, which could have signaled the start of a structure with higher highs and higher lows — something that would have presented a clean long opportunity 📈. However, during the U.S. session, the NAS100 momentum shifted and we instead saw a bearish breakdown, invalidating the previous setup 🚫
As things stand now, there's no clear directional bias on the 4H — just a sideways range with neither bulls nor bears in full control 🤝. This type of environment calls for patience and discipline.
It's worth noting that knowing when not to trade is just as important as knowing when to pull the trigger. Sitting on the sidelines and allowing the market to make the next move — whether that’s a break above or below this consolidation range — is a valid and often wise decision 🧘♂️📊
At the moment, my preference is to remain neutral and let price show its hand before committing to a position.
⚠️ Disclaimer:
This analysis is for educational purposes only and does not constitute financial advice. Always do your own research and apply proper risk management when trading.

Missiles in the Middle East, Headwinds on Nasdaq: NAS100 onHey There;
The trend line on the NAS100 has been broken to the downside. My target level after this breakout is 21,299.47. If the price moves towards this level, I think it will reach my target in line with fundamental analysis due to the broken trend line and Iran-Israel war tensions.
I meticulously prepare these analyses for you, and I sincerely appreciate your support through likes. Every like from you is my biggest motivation to continue sharing my analyses.
I’m truly grateful for each of you—love to all my followers💙💙💙

NASDAQ 100 Bullish Breakout Potential: What to Watch NextI'm currently monitoring the NASDAQ 100 (NAS100) very closely. Building on yesterday’s outlook, we've now seen a clear bullish structural shift — price is holding firm above a recent higher high and higher low, suggesting the early stages of a potential trend continuation 📈
Zooming into the 30-minute chart, we can track price action more precisely. I’m watching for a decisive break above the current range high on this timeframe. If we get the break → retest → rejection pattern, this would confirm bullish momentum and provide a long opportunity 🚀
Should this scenario play out, we could also see JPY pairs strengthen to the upside, as a risk-on sentiment flows through the markets 🧭
🔍 This setup is developing — as always, patience and precision are key.

NASDAQ Close to the 1st 1D Golden Cross in 2 years!Nasdaq (NDX) has been trading within a Channel Up since the December 2022 Low and is currently extending the gains of the latest Bullish Leg.
At the same time it is about to form the first 1D Golden Cross in more than 2 years (since March 08 2023). The last two major Bullish Legs of this pattern, before the previous one was interrupted by the Trade War, were pretty symmetrical, peaking at +49.21% and +47.47% respectively.
If the current one follows the +47.47% 'minimum', we should be expecting Nasdaq to hit 24000 by late Q3.
-------------------------------------------------------------------------------
** Please LIKE 👍, FOLLOW ✅, SHARE 🙌 and COMMENT ✍ if you enjoy this idea! Also share your ideas and charts in the comments section below! This is best way to keep it relevant, support us, keep the content here free and allow the idea to reach as many people as possible. **
-------------------------------------------------------------------------------
Disclosure: I am part of Trade Nation's Influencer program and receive a monthly fee for using their TradingView charts in my analysis.
💸💸💸💸💸💸
👇 👇 👇 👇 👇 👇
