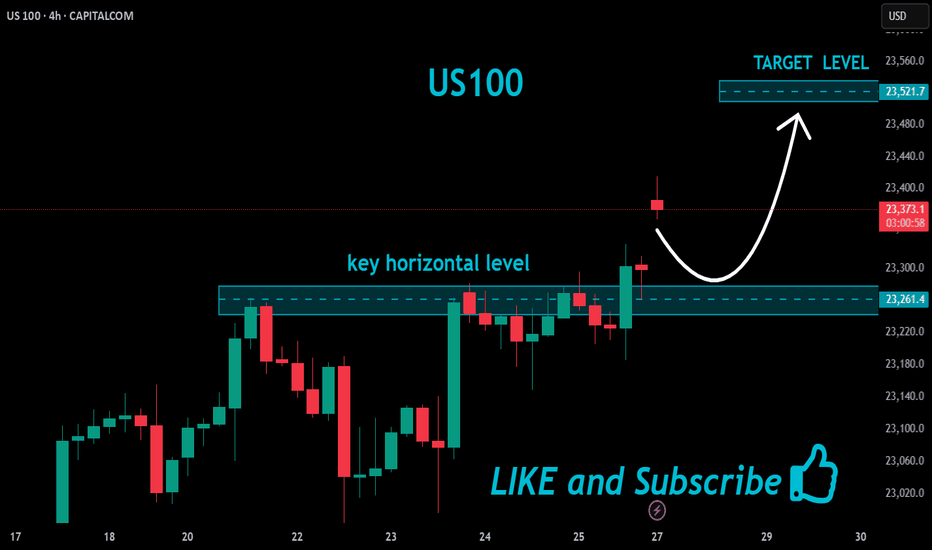
Us100future
US100 Short From Resistance!
HI,Traders !
US100 is weaker than we
Expected and failed to break
The key horizontal level
Around 22868.6 and we are
Now seeing a bearish rejection
So we are locally bearish biased
And we will be expecting a
Further bearish move down !
Comment and subscribe to help us grow !
US100 Resistance Cluster Above!
HI,Traders !
#US100 made a bearish
Breakout of the support
Cluster of the rising and
Horizontal support levels
Which is now a resistance
Cluster round 22703.9 then
Went down and made a local
Pullback on Monday but we are bearish
Biased mid-term so we
Will be expecting a further
Bearish move down this week !
Comment and subscribe to help us grow !
US100 WEEKLY ANALYSISHello, traders here is an analysis of US100 as you can see the price has been in a bullish form for the past weeks so I have conducted support and resistance setup to predict the price direction in the next coming days/weeks, as you can see the price have just broken a resistance zone and now I will look for a pullback to that zone then look for long opportunities.
Nasdaq US100 long Aim for Strong Monthly Performance Aim for Strong Monthly Performance Ahead of PCE Data
Looking at the second quarter, the S&P 500 has risen 6.99%, set for a third straight quarter of gains. The Nasdaq boasts a gain of 11.2%, marking back-to-back positive quarters. The Dow has jumped 2.55%, also heading for a third winning quarter.
A Break above 14020 Could change The big SidewaysThe number of Americans filing for unemployment benefits fell to 242 thousand in the week ending May 13th, down from an 18-month high of 264 thousand and below market expectations of 254 thousand. The latest reading indicated the labor market in the United States remains relatively tight, potentially leading to upward pressure on wages and providing the Federal Reserve with an opportunity to implement further interest rate hikes in its efforts to combat inflation.
The Philadelphia Fed Manufacturing Index in the US increased to -10.4 in May of 2023 from a nearly three-year low of -31.3 in April, and better than market forecasts of -19.8. General manufacturing activity in Philadelphia continued to decline overall but at at the slowest pace in four months. New orders (-8.9 vs -22.7) and shipments (-4.7 vs -7.3) rose from last month but remained negative while employment declined (-8.6 vs -0.2). The price indexes remained below long-run averages, with the prices received index declining further (-7 vs -3.3) The survey’s future indexes continued to reflect muted expectations for growth (-10.3 vs -1.5), with almost
37% of the firms expecting a decrease in activity over the next six months.
US futures were mixed on Thursday, with contracts on the Dow Jones down nearly 30 points while both the S&P 500 and the Nasdaq were above the flatline. Shares of Walmart were up 1.7% in premarket trading after the retailer raised its full-year forecast and earnings topped forecasts. At the same time, traders become increasingly optimistic the debt ceiling standoff would soon be solved and the US will avoid a default. Also, regional banks are also expected to extend gains when markets open. However, the latest data showed weekly claims fell more-than-expected last week, triggering fears of more Fed interest rate hikes.
I asked Chat GPT How US100 Price will changeS3
13215.8
S2
13240
S1
13251.1
R1
13275.3
R2
13288.4
R3
13312.6
My current strategy Bullish
I asked chatgpt how she sees US100 of the future.
And the answer is not too far away of my researches. I tried to visualize chatgpt answer
The blue cuve is the pojected price developement by chatgpt.
A little fun factor, so dont take it seriousely and letS STOCK TO OUR OWN TRADINGPLAN
CURRENTLY THE PROJECTED DEVELOPEMENT our own signals are sync.
But I will closely compare chatgpt tadingplan and mine. So you can do the same ,if you like.
Please feel welcomed to comment and shareyour ideas and inspire us as well.
At leasst trades do nothing else, but trading the future possible events and developements at the current time being.
Interesting is, that the most pice reverseals sync nealy closed to the prior Vps.
I remember a quote of Richar Dennis, the foundeof the TurtleTaders:
Traders ae the stundents of the makets.


