NAS100 Technical Analysis & Trade Idea PLUS Navigating S&R👀👉 The NAS100 has been showing a solid bullish trend on the higher time frames, however we are seeing a pullback currently. I'm closely watching for a potential buying opportunity based on key conditions outlined in the video. We'll explore the critical price action signals to watch for and how to position yourself effectively to capitalize on the next move. Disclaimer: This analysis is provided for informational purposes only and should not be considered financial advice.📊✅
Us100idea

US100 Bearish Breakout! US100 was trading along
The rising support line
But now we are seeing
A bearish breakout so
We are now bearish biased
And we will be expecting
A further move down !

NASDAQ / US100 /US Tech Money Heist Plan on Bullish SideMy Dear Robbers / Money Makers & Newbies,
This is our master plan to Heist US100 / NAS100 / US Tech Market based on Thief Trading style Technical Analysis.. kindly please follow the plan I have mentioned in the chart focus on Long entry. Our target is Red Zone that is High risk Dangerous level, market is overbought / Consolidation / Trend Reversal at the level Bearish Robbers / Traders gain the strength. Be safe and be careful and Be rich.
Note: If you've got a lot of money you can get out right away otherwise you can join with a swing trade robbers and continue the heist plan, Use Trailing SL to protect our money.
Entry : Can be taken Anywhere, What I suggest you to Place Buy Limit Orders in 15mins Timeframe Recent / Nearest Swing Low
Stop Loss : Recent Swing Low using 2h timeframe
Warning : Fundamental Analysis comes against our robbery plan. our plan will be ruined smash the Stop Loss. Don't Enter the market at the news update.
Loot and escape on the target 🎯 Swing Traders Plz Book the partial sum of money and wait for next breakout of dynamic level / Order block, Once it is cleared we can continue our heist plan to next new target.
Support our Robbery plan we can easily make money & take money 💰💵 Follow, Like & Share with your friends and Lovers. Make our Robbery Team Very Strong Join Ur hands with US. Loot Everything in this market everyday make money easily with Thief Trading Style.

US100I will be patiently waiting for a dip around that demand zone before going long for now I estimate a consolidation slowly to the downside.

NASDAQNasdaq analysis
Weekly and daily time frame
The price can return to the midline of the daily trading range and move towards the weekly resistance from there.

NASDAQ Pair : US100 - Nasdaq
Description :
Completed " 12345 " Impulsive Waves
Break of Structure
RSI - Divergence
Exp FIAT as an Corrective Pattern in Short Time Frame
Fibonacci Level - 261.8%

nas100 institutional tactics setupnas100 1:4,5 Risk reward setup
if you like my idea please hit the like button follow and subscribe wish you good luck and good trading
Show some Love Peace brothers and sisters

US100 - Looking for Bearish Breakout and a Short Trade Signal💡Hello Traders!
This is my idea for US100. I expect a retracement until the Bearish OB and after that, to look for a short trade entry as I expect a bearish breakout of the market on US indices.
In case of confirmation, I will execute this trade.
Please LIKE 👍, FOLLOW ✅, SHARE 🙌, and COMMENT ✍ if you enjoy this idea! Also, share your ideas and charts in the comments section below! This is the best way to keep it relevant, support us, keep the content here free, and allow the idea to reach as many people as possible.
____________________________________
www.tradingview.com

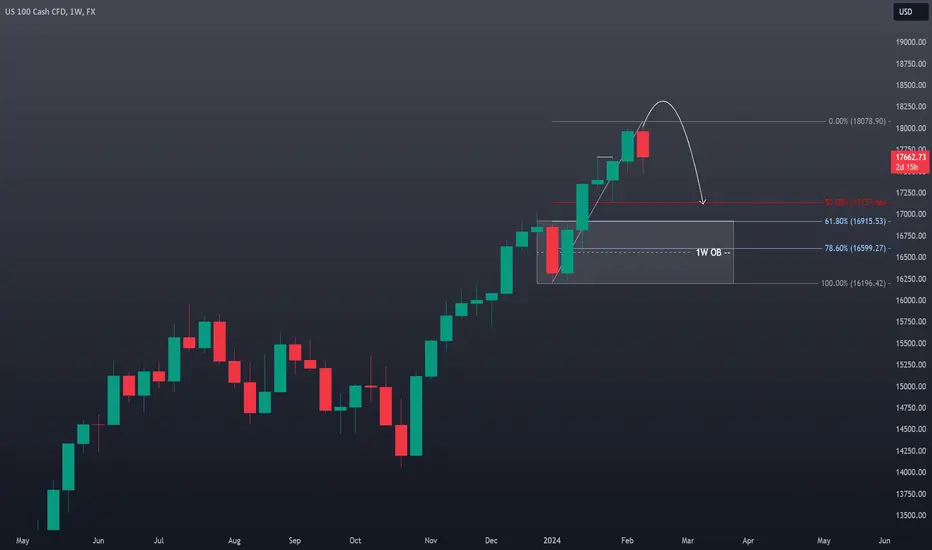
NAS100 Technical Analysis and Trade Idea - Full ExplanationMarket Observations: The #NAS100 has maintained a bullish trajectory. However, price action on the monthly timeframe suggest the #US100 is overextended. Additionally, the weekly chart reveals a double top pattern, hinting at a potential retracement down to the 50-61.8% Fibonacci levels. This area could provide the liquidity needed for major market players to fill long orders.
Trade Strategy: Consider an intraday/swing trade short entry following a potential stop run above the current range. Target an initial profit level around the previous lows near 17250, with a secondary target at 17000 (slightly above the 61.8% Fibonacci level on a 1W chart). Implement a well-placed stop-loss order to manage risk effectively.
Disclaimer: This analysis is based on my observations and does not constitute financial advice. Conduct your own independent research and carefully assess your risk tolerance before making investment decisions.

NAS100 Technical Analysis and Trade Idea
Market Observations: The #NAS100 has maintained a bullish trajectory. However, price action on the monthly timeframe suggest the #US100 is overextended. Additionally, the weekly chart reveals a double top pattern, hinting at a potential retracement down to the 50-61.8% Fibonacci levels. This area could provide the liquidity needed for major market players to fill long orders.
Trade Strategy: Consider an intraday/swing trade short entry following a potential stop run above the current range. Target an initial profit level around the previous lows near 17250, with a secondary target at 17000 (slightly above the 61.8% Fibonacci level on a 1W chart). Implement a well-placed stop-loss order to manage risk effectively.
Disclaimer: This analysis is based on my observations and does not constitute financial advice. Conduct your own independent research and carefully assess your risk tolerance before making investment decisions.
NAS100 Technical AnalysisThe #NAS100 has been on an upward trend, but a potential triple top pattern is forming on the chart. If the #DXY retraces further and rebounds from support, the #US100 could spike above the current high, potentially taking out buy-side stop-loss orders before pulling back down to the 61.8% Fibonacci level. Remember, trading the #NASDAQ involves significant risk. This analysis is just my opinion and shouldn't be considered financial advice.

US100 Strong Resistance Ahead!US100 made nice bullish
Move up but a strong
Horizontal resistance is ahead
At 17638.5 from where I think
We will see a bearish reaction !

US100 M30 / Short Trade Opportunity on US indices ✅ Hello Traders!
This is my Idea related to UA100. I expect a bearish move if confirms the breakout of the mentioned BOSS. It also will be a sign of a bearish market structure.
I expect that FVG H1 will be closed, this area represents also my target.
Traders, if you liked my idea or if you have a different vision related to this trade, write in the comments. I will be glad to see your perspective.
____________________________________
Follow, like, and comment to see my content:
www.tradingview.com

NAS100 Trade IdeaThe NAS100 experienced a substantial rally towards the end of last week, displaying signs of being significantly overextended. A retracement may be in store, particularly if the Dollar Index (DXY) maintains and strengthens its position, considering the general inverse correlation between DXY and US100. It is essential to emphasize that this analysis is provided exclusively for educational purposes and should not be construed as financial advice.

US100 H4 / LONG TRADE OPPORTUNITY 📈 ✅Hello Traders!
This is my idea on US100 H4. I see a perfect retracement from the resistance level marked on the chart. I consider this a good sign of a small retracement.
Traders, if you liked my idea or if you have a different vision related to this trade, write in the comments. I will be glad to see your perspective.
____________________________________
Follow, like, and comment to see my content:
www.tradingview.com

US100 NASDAQ Technical Analysis and Trade Idea NAS100Sharp Retracement in NAS100: Opportunity on the Horizon?
Eyes are laser-focused on the NAS100 after it slammed into a key resistance level. The current aggressive pullback sets the stage for an intriguing dynamic ahead of the NFP data drop later today. A strong dollar boost (or unexpected weakness) could significantly impact the index, making this data release a potential swing point.
With such a sharp retracement already underway, I'm eyeing a potential long entry as the price plunges towards a crucial support zone. In the video, we dissected the trend, price action, market structure, and other technical essentials to build a comprehensive picture.
Remember: This analysis is purely for educational purposes and should not be interpreted as financial advice. Do your own due diligence before making any trading decisions.

NAS100 US100 Technical Analysis London Open / NY OpenThis video provides a detailed analysis of the NASDAQ. Presently, it has reached a robust resistance level on the weekly timeframe. The market appears quite stretched, presenting a potential counter-trend trading opportunity around the London Open. If missed, there might be another chance around the New York Open later today. Throughout the video, we delve into essential technical aspects such as price action, market structure, and the prevailing trend. It's crucial to note that this content is purely educational and should not be interpreted as financial advice.

NAS100 US100 Technical Analysis and Trade Idea NASDAQIn this insightful video, we delve into the NAS100's intriguing movements as it encounters crucial resistance levels on both the monthly and weekly charts. With the week drawing to a close, we scrutinize the possibility of an assertive retracement.
Our discussion extends beyond surface analysis, encompassing market structure, intricate price actions, meticulous trend analysis, and pivotal elements of technical analysis. This comprehensive coverage sheds light on the intricate dynamics shaping the NAS100's trajectory.
As a standard practice, this video offers a comprehensive view for educational purposes. However, it's essential to clarify that the content presented here isn't intended as financial advice.

US100 NAS100 Technical Analysis And Trade IdeaIn this presentation, we undertake a thorough analysis of the NASDAQ US100, concentrating on the prevalent bullish sentiment within the 1-month (1M) and 1-week (1W) timeframes. Significantly, our charts reveal that the US100 is currently approaching a critical resistance level, marking a pivotal juncture. Throughout this discourse, we delve into the fundamental principles of technical analysis, encompassing essential elements such as assessing the existing market trend, price dynamics, market structure, and other crucial facets of technical analysis. As we proceed through the video, we meticulously examine a potential trading opportunity within the NAS100.
It is crucial to emphasize that the insights shared in this content are intended exclusively for educational purposes and should not be interpreted as financial advice. Engaging in foreign exchange market trading carries a substantial level of risk. Therefore, it is imperative to judiciously incorporate robust risk management strategies into your trading plan to effectively navigate these challenges.

US100 Technical Analysis And Trade Idea NAS100In this video, we conduct an extensive analysis of the US100 NASDAQ, with a primary emphasis on the prevailing bullish price swing observed in the 1-day (1D) and 1-week (1W) timeframes. Notably, the currency pair is approaching a pivotal resistance level, indicating the potential for another leg down. Throughout our discourse, we delve deeply into the intricate facets of technical analysis, encompassing the current market trend, price dynamics, market structure, and other pivotal elements of TA. As we progress through the video, we take a look at an potential trade opportunity.
It is of utmost importance to underscore that the information provided in this presentation is intended solely for educational purposes and should not be construed as financial advice. It is imperative to recognize that engagement in foreign exchange trading carries a substantial degree of risk. Consequently, it is vital to judiciously integrate robust risk management strategies into your trading plan.

US100 NAS100 Technical Analysis and Trade IdeaIn this video, we conduct an in-depth analysis of the NAS100, focusing on its current bearish sentiment evident on the higher timeframes. Notably, the US100 index has recently approached a critical support level. Our discussion within the video encompasses vital components of technical analysis, such as the prevailing trend, price action dynamics, market structure, and other fundamental aspects of technical analysis. Towards the latter part of the video, we explore a potential trade opportunity.
It is crucial to emphasize that the content presented is exclusively for educational purposes and should not be regarded as financial advice. It is essential to acknowledge that trading in the currency markets involves a significant level of risk. Consequently, the prudent integration of risk management strategies into your trading plan is absolutely imperative.

NAS100 Technical analysis and Trade Idea US100In this video, we conduct an in-depth analysis of the NAS100. Taking a close look at both the weekly and daily timeframes, we can see the emergence of a prominent topping chart pattern characterized by a sequence of lower highs and lower lows, prominently visible on the US100 daily chart. In this video, we delve into various facets of technical analysis, including the prevailing trend, price action, and market structure. We also explore a potential trading opportunity. As always, it's crucial to emphasize that the content presented is solely for educational purposes, and it should not be construed as financial advice.

US100 Technical Analysis and Trade IdeaI'd like to share my insights on the US100. As the week is coming to a close, it's important to be mindful of potential stop runs by institutional traders, which can be quite aggressive on Fridays. Additionally, we have the Non-Farm Payrolls (NFP) report scheduled later today, so if you're considering trading, exercise extreme caution.
These remarks are more in the context of a potential trading setup should we witness a retracement today, possibly setting the stage for Monday. It's crucial to remember that the information in this video is intended for educational purposes only and should not be considered as financial advice. Please ensure that you apply robust risk management techniques when engaging in trading.
Wishing you a wonderful weekend ahead!
