US 10Y TREASURY: jobs data aheadThe Fed's favorite inflation gauge was posted during the previous week, which impacted some higher volatility in the U.S. Treasury yields. The Personal Consumption Expenditure index ended May by 0,1% higher from the previous month, bringing the index to the level of 2,3% on a yearly basis. The core PCE remained a bit elevated with 0,2% in May and 2,7% for the year. Still, both figures were in line with market expectations, which was the main reason for 10Y U.S. Treasury benchmark yields drop to the level of 4,25% at the end of the week, from 4,40% where the week started.
A drop in inflation figures are increasing market expectations that the Fed might cut interest rates in September. However, a week ahead might bring again some higher volatility in the U.S. Treasury yields as the major jobs data will be posted. For the week ahead the JOLTs Job Openings, the Non-farm Payrolls and the June unemployment will be posted. Considering Fed's dual mandate, bonds market participants will be closely watching these data.
Us10y!

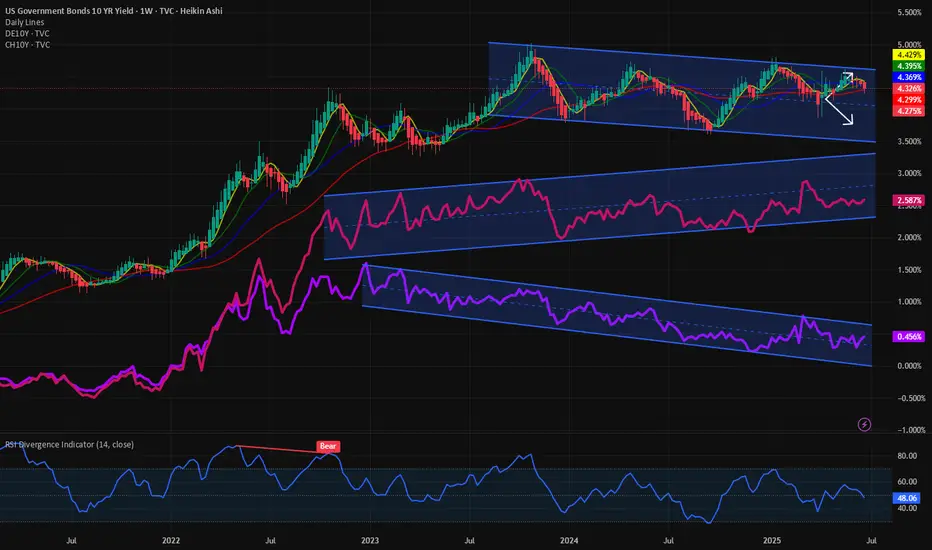
Price of fiscal profligacy: US10Y vs DE10Y vs CH10Y Today I will go unconventional in my analysis and look at the yields of 3 major economies with 3 different fiscal trajectories. Today we look at the 10Y Yield of US, Germany and Switzerland. 3 different countries with different Fiscal and Monetary policies off late.
The TVC:US10Y after touching the highs of 5% in Oct 2023 has been in a downward trend making new lower highs and lower lows but within the downward slopping channel sweeping the upper bound and the lower bound. Recently, touching the higher bound of the channel at 4.5%, since then it has reversed its course and gone down. On 26th May my article on TVC:US10Y and TVC:DXY forecasted 4.6% as the upper bound for the $US10Y. TVC:US10Y and TVC:DXY Divergence and correlation breakdown for TVC:US10Y by RabishankarBiswal — TradingView . We recently got rejected at 4.51%. So, the obvious direction for TVC:US10Y is lower with 3.5% as the lowest target.
Now switching gear to $DE10Y. The German Bunds are doing the reverse. They are making a series of new higher highs and higher lows. With increasing yields on the TVC:DE10Y and fiscal indiscipline on the part of German govt this is going to rise in the medium to long term.
Then we finally look at the Swiss 10Y which might touch ‘Negative’ in the near term. The Swiss central bank is on the path to reduce the rates to negative in Sept 25 meeting. The TVC:CH10Y at 0.45% brings back the memory of negative rates. But with global flight to safety and a fiscally conservative government the TVC:CH10Y is in huge demand hence pushing down the yields.
Verdict : TVC:US10Y ↘ between 4.3% - 3.5%, TVC:DE10Y ↗ between 2% - 3%, TVC:CH10Y TVC:US10Y ↘ between 0.5% - (- 0.25%)
Dollar Bullish Correction To $103 - $105While we expected to see some Dollar upside in Q2, the economy was in such a bad state that the Dollar could not hold its value. Since the start of 2025 the Dollar is down 12% and this is only the beginning.
I believe we will see more downside in the future. But for the coming quarter there is a chance for the Dollar to get some breathing space & recover in the short term. Overall, the trend of the Dollar remains bearish, so what we want to keep an eye on is small pumps (short term recovery) into price zones which will allow us to short the Dollar back down.
I want to see a dip lower towards $96 - $94 before sellers lose bearish momentum. If this move takes place, then we can slowly see buyers step back into the market & start pushing back to the upside. Once price hits our ‘Supply Zone’ of $103 again, it’ll give us a more clear indication of what the Dollar will do next; whether that’s a longer term uptrend or a continuation to the downside.

Dollar Index Bearish to $96 (UPDATE)I posted this DXY sell thesis yesterday for you all while price was still at $97.70. Since then sellers have taken out the previous Wave 3 low, creating a new daily low today at $96.90📉
We still have more downside yet to come towards our $96.60 target. So, use this 'DXY Sell Thesis' to help you with your trading, so once you can use this as a confluence to buy inverse correlated markets

US 10Y TREASURY: digesting FOMC ahead of PCEThe central event for financial markets during the previous week was the FOMC meeting. The Fed decided to hold interest rates at current levels, but two rate cuts till the end of this year are still on the table. This was in line with market expectations. Still, the Fed Chair Powell shortly commented on the potential for higher inflation in the coming period, as a reflection of implemented trade tariffs of the US Administration. The Fed is expecting to see it reflected in the inflation figures in the future period, but they will continue to be data-driven when deciding on interest rates.
Due to the FOMC meeting, the 10Y Treasury benchmark was moving with a higher volatility during the week, as was expected. The nervousness regarding Fed's next move on interest rates was high for some time in the past. The 10Y yields started the week around the 4,5% while ending it at 4,37%. The PCE data are scheduled for a release in the week ahead. If there are no surprises with the data, it could be expected that 10Y yields will have a relatively calmer week, with further relaxation in yields, moving above the 4,3% level.
US 10Y TREASURY: eyes FOMC projections The US inflation data were posted during the previous week, showing that the inflation continues to slow down, with 0,1% in May. Also, the University of Michigan Consumer Sentiment data are showing decreasing inflation expectations for this year at 5,1%, from previously posted 6,6%, while the five year expectation eased to the level of 4,2%. However, the unrest on markets was imposed by new Middle East tensions, which were also reflected in the Treasury yields during the previous week. The 10Y yields started the week at 4,5%, and closed it at 4,4%. The lowest weekly level was at 4,3% on Friday, but the Middle East unrest pushed the yields toward the 4,4%.
The week ahead brings the FOMC meeting and Feds macro projections, which is scheduled for Wednesday, June 18th. It is widely expected that the Fed will leave rates unchanged at this meeting, while the odds are increased for a rate cut in September. Certainly, the day of the FOMC meeting will bring some increased volatility, considering investors sensitivity to the Fed's narrative and especially projections. The next supporting level for the 10Y yields stands at 4,2%. However, considering the current unstable geopolitical scene as well as the FOMC meeting, there is also an equal probability for 10Y yields to test higher grounds, around the 4,5% level, but not higher from it.

US10Y Big downside potentialThe U.S. Government Bonds 10YR Yield (US10Y) has been since last week on a 1D MA50 (blue trend-line) rebound, consistently rising since the April 04 Low (Support 1). The presence of the Lower Highs trend-line just above it, puts strong selling pressure long-term.
As a result, either now or upon a Lower Highs contact, we expect the US10Y to turn bearish and Target 3.860% (Support 1).
-------------------------------------------------------------------------------
** Please LIKE 👍, FOLLOW ✅, SHARE 🙌 and COMMENT ✍ if you enjoy this idea! Also share your ideas and charts in the comments section below! This is best way to keep it relevant, support us, keep the content here free and allow the idea to reach as many people as possible. **
-------------------------------------------------------------------------------
💸💸💸💸💸💸
👇 👇 👇 👇 👇 👇

US10Y (10-Year Treasury Yield) Weekly TF 2025
📊 Chart Context
Current Yield: \~4.50%
Current Structure: Consolidation below major Fibonacci resistance, with multiple breakout and breakdown paths marked by confluence zones.
📉 Key Technical Observations
Bullish Scenario – Yield Rally (Rate Hike Cycle / Inflation Surprise)
TP1 (5.0%): 0.00% Fib level, psychological resistance.
TP2 (6.10%): 38.2% Fib + -27% extension zone.
TP3 (7.70%–7.91%): Major Fib confluence (-61.8% & 48.60% projection)
Bearish Scenario – Yield Drop (Rate Cuts / Recession)
Support 1 (3.91%): 23.6% Fib retracement, key structural demand.
Support 2 (3.22%): 38.2% retracement
Support 3 (2.74%): 48.6%
Support 4 (2.12%): 61.8%
Support 5 (1.33%): 78.6%
Forecast Scenarios (Based on Arrow Colors & Pathways):
Red Boxes & Zones: Critical Resistance / Reaction Zones
These are strong confluence levels that may trigger pullbacks before continuation.
Green Arrows – Bullish Projection with Pullbacks
Scenario A: Price may rally toward the 5.0% TP1 zone but experience a temporary pullback before continuing toward the 6.10% TP2 zone.
Scenario B: After a short-term correction near 6.10%, if bullish momentum sustains, yield may spike toward the 7.70–7.91% TP3 zone.
These movements reflect a stair-step advance with corrective legs between key levels — bullish macro outlook with intermittent risk events.
Pink Arrows – Bearish Pullbacks & Correction Phases:
Scenario A: Initial rejection from current zone (~4.5%) may send yields down to the 3.91% support confluence.
Scenario B: If support at 3.91% fails, yields may further retrace to 3.22% or 2.74%, activating the lower fib retracement zones.
After stabilizing in these zones, a rebound may begin and realign with the broader bullish structure.
These pink arrows suggest that even in bullish macro cycles, the market may correct deeply before resuming its ascent.
Macro & Fundamental Context:
1.Fed Pivot Dynamics: With inflation cooling and unemployment ticking higher, markets price in possible Fed rate cuts by late 2025.
2.Bond Demand Outlook: Recession fears and de-risking scenarios trigger massive flows into long-term Treasuries, pulling yields lower.
3.Global Liquidity Conditions: Lower yields = increased liquidity = favorable conditions for crypto, gold, and risk assets.
4.Hawkish Risk: Any oil shock or CPI surprise can pause or reverse easing expectations, pushing yields up.
Effects on Gold & Crypto (as scenarios play out):
↗ If US10Y Yields RISE to 6% or 7.7% (TP2/TP3)
* Gold: Likely to suffer due to rising real yields; institutional demand weakens.
* Crypto: Bearish; risk assets sell off amid higher opportunity cost and tighter liquidity.
* Dollar (DXY): May strengthen, applying more pressure on gold & crypto.
* Strategy: Favor defensive positioning. Look for shorting rallies or hedge exposures in BTC, ETH, and high-beta alts.
↘ If US10Y Yields FALL toward 3.2% to 2.1% (Support 2–4):
* Gold: Bullish. Lower yields reduce holding costs and boost safe-haven appeal.
* Crypto: Bullish. Liquidity rotation into high-risk assets often follows easing cycles.
* DXY: Likely to weaken, further supporting BTC and altcoins.
* Strategy: Look to accumulate crypto during dips. Gold may offer breakout opportunities.
Rangebound Near 4.5% (Current Zone):
* Gold: Mixed; capped upside until clear direction emerges.
* Crypto: Ranges or whipsaws. Watch for breakout signals from BTC.D and TOTAL3.
* Strategy: Stay cautious. Monitor DXY and macro events for confirmation.
Related Reference Charts
TOTAL3 – Altcoin Market Cap Weekly
BTC.D – Bitcoin Dominance Weekly

US 10Y TREASURY: will the Fed cut?The jobs market data were in the spotlight of investors during the previous week. The major impact came from the non-farm payrolls posted on Friday, which was better than anticipated with 139K new jobs added. The jobs market in the US continues to hold strongly, which impacts investors anticipation of potential Fed's rate cut during the course of this year. Namely, as the Fed has a dual mandate of keeping inflation at targeted level and exercising full employment, the stronger jobs market might impact Fed's decision to hold reference interest rates at current levels for a longer period of time. The CME FedWatch tool is currently anticipating 100% odds that the Fed will hold interest rates steady at their June meeting. The FOMC June meeting is scheduled for 17th-18th.
The jobs data triggered a strong reaction on the US Treasury market. The 10Y US benchmark yields were pushed to the upside on Friday, from 4,32% on Thursday up to 4,50% on Friday. Usually, after such a strong spike in prices or yields on the market, there is time when the market will consolidate, in which sense, there is a probability that yields will ease to some extent during the week ahead. Still, the market nervousness might continue to the lower extent until the FOMC meeting.

Story behind EURUSD chart and US10Y and DE10Y risk premiumLet’s have a look at the Currency and Bond markets today after an eventful last few weeks in both markets. After Moody’s downgrade of the US Gov bonds the markets look seemingly quiet. There has been no sudden spike in the US10Y. But it makes lot of sense to look beneath the hood and compare the Bond and the currency markets. Today we are looking into the 2 largest currency pairs, i.e. FX:EURUSD and the largest bond markets i.e. US10Y and German 10Y.
It is astounding to observe how the Fib retracement levels from the peak and troughs in the FX:EURUSD and TVC:US10 - TVC:DE10Y charts coincide. Both indicators at @ 0.618 Fib levels. As anyone would expect when the FX:EURUSD makes new highs the diff between TVC:US10Y and TVC:DE10Y hits new highs as investors long the FX:EURUSD chart and in that way hedge the risk in the TVC:US10Y without going short TVC:US10Y which will then adversely affect the investors portfolio. Institutional investors have been unwinding the long position in the TVC:US10Y by going long EUR, YEN and CHF in the currency markets without explicitly selling the US10Y.
Going back to the charts, what can we expect in the medium to long term? In my expectation both the charts can reach 0.786 Fib level and subsequently the 1.0 Levels. This will take the FX:EURUSD from 1.13 to 1.18 by the end of 2025 and then to our long-term target of 1.25. If those levels hold onto in the currency markets, then the risk premium of TVC:US10Y over TVC:DE10Y which is denoted in the chart by TVC:US10Y - TVC:DE10Y will go from 1.9% to 2.1% and then top out at 2.3%. May be this is the way USD will lose some of its market share as world reserve currency status.
Verdict: USD Reserve currency status weakening. Buoyant FX:EURUSD marching towards 1.25. TVC:US10Y - TVC:DE10Y can reach 2.3%.

US 10Y TREASURY: eased inflation expectationsTrade tariffs continue to gain a lot of investors attention, but they are slowly turning to actual macro data and inflation expectations in the future period. Uncertainty over the future impact of imposed trade tariffs of the US Administration is still present, but it becomes evident that investors are becoming tired of reactions on tweets, and are much more switching attention to actual data. The University of Michigan Consumer Sentiment final data for May, posted during the previous week, showed moderately decreased inflation expectations for the period of next five years. Data showed that US consumers are expecting five years inflation at the level of 4,2%, which was also below market estimate of 4,6%.
The 10Y US Treasury yields eased a bit during the previous week, currently testing the 4,4% level. The starting weekly point was at 4,53%. Considering the relatively significant drop during the week, there is some probability for the short reversal during the week ahead, at least till the level of 4,5%. It should also be considered that the week ahead macro data will put in focus jobs data and NFP, which might imply a bit higher volatility.
$US10Y and $DXY Divergence and correlation breakdownRecent weeks we might have missed some underlying churn in the market dynamics. Recently there has been a clear visible divergence in TVC:US10Y and TVC:DXY in midst of all the noise about the tariffs. Usually with rising TVC:US10Y yield the US Dollar index TVC:DXY rises with it as visible in the chart below. In this blog we have been following the downward slopping channel in the TVC:US10Y and the yield has remained within this tight range of the channel. In our last blog on 02 May 25 we called for a lower TVC:US10Y @ 4%. Seems that call was incorrect and I was wrong. But in this space, we have been asking for a lower $DXY. The TVC:DXY chart is making lower highs and lower lows and in a verge of a breakdown.
So we have higher TVC:US10Y which is capped to the upside @ 4.6% visible from the upper end of the downward slopping channel and we have TVC:DXY making lower lows but the correlation is broken in the recent weeks as shown in the daily chart below. This kind of unpredictable market behavior it’s difficult to forecast equity market direction. TVC:US10Y seems to create headwind for equities but the lower TVC:DXY is good for risk assets like CRYPTOCAP:BTC , SP:SPX and $QQQ. Hence this push and pull will keep the markets range bound for now.
Verdict : TVC:US10Y currently at top of the range, downside more likely ; TVC:DXY continues to struggle and in penalty box.

US 10Y TREASURY: heading higherTrade tariffs once again shaped market sentiment during the previous week. The US Administration announced the intent for introduction of 50% tariffs on goods imported from the European Union, which should become effective from 1st July this year. Market immediately reacted to this news, bringing US equities lower, and surging US treasuries. Another news that hit the market and impacted negatively US yields was that the US House of Representatives adopted a tax and spending bill, which is expected to add trillions of US Dollars to the US debt, as analysts are noting. The US has already been downgraded twice by rating agencies, last week by Moody’s, due to high concerns over the sustainability of the US debt.
The 10Y US benchmark reached the highest weekly value at 4,62%, but eased as of the end of the week to the level of 4,50%. This type of swings in the Treasury yields will most probably continue in the coming period. The market is currently extremely sensitive to fundamentals and any news regarding trade tariffs.
GOLD Regains Above 3'300, since US stocks "Relief Rally" is OverGold prices recently surged above $3,300 per ounce due to a confluence of geopolitical, economic, and monetary factors driving strong safe-haven demand:
Heightened geopolitical tensions, particularly the Israel-Hamas conflict and ongoing US-China trade disputes, have increased uncertainty, prompting investors to seek Gold as a secure store of value amid instability.
The US dollar's weakness, nearing a three-year low, has further boosted gold's appeal for holders of other currencies, making Gold relatively cheaper and more attractive globally.
What is most important also, U.S. stock rally has overed recently its tedious 10-Day winning strike (fortunately which finished not at all the history peaks). That's why investors may be turning back to tried-and-true assets like Gold.
Central banks, notably China’s, have been consistently buying gold to diversify reserves away from the US dollar, supporting prices significantly. China increased its Gold reserves for the 17th consecutive month, signaling sustained institutional demand.
Additionally, gold-backed exchange-traded funds (ETFs) have seen record inflows, reflecting growing investor interest beyond traditional buyers.
Market expectations of Federal Reserve interest rate cuts later in 2025 have also played a key role. Lower interest rates reduce the opportunity cost of holding non-yielding gold, enhancing its investment appeal amid inflation concerns and economic growth uncertainties.
This combination of geopolitical risk, a weaker dollar, central bank purchases, and anticipated monetary easing has propelled gold prices to historic highs, with forecasts suggesting further gains toward $3,500 per ounce.
--
Best #GODL wishes,
@PandorraResearch Team 😎

US 10Y TREASURY: US downgradeThere is no rest for US Treasuries. The minute the trade tensions between the US and China were settled, at least for the period of 90 days, a new storm hit the market throughout rising concerns over the sustainability of the US debt. At least as this sustainability is perceived by the rating agency Moody’s, which downgraded the US sovereign rating by one notch late Friday. This news had an negative impact on the investors sentiment, but the most volatility in the US Treasury yields occurred in an after-hours trading on Friday, when the news hit the market.
Regardless of the news about US sovereign downgrade, the higher volatility was evident also during the previous week. The highest surprise came from the University of Michigan inflation expectations, which reached 7,3% for this year and 4,6% in a period of five years. This was higher from the previous estimate and certainly was a reflection of the imposed trade tariffs between the US and China. The highest weekly level of the 10Y US benchmark was 4,54%, however, yields are ending the week at the level of 4,44% in an after-hours trading on Friday. For the week ahead, there is no significant macro data scheduled for a release, however, the volatility might continue, especially on Monday. The reaction on a downgrade news might impose some increase in yields, until the market finds the new equilibrium level. On the opposite side some modest relaxation is also probable, around 4,0%-3,8% level.

US10 YR Yield Weekly Chart Analysis: NFAUpdate: May 15, 2025
-As per my last update(April 5, 2025) about the gap between March 24th candle and March 31st candle that any candle body close above that gap will invert that gap from resistance to support and Upside target will be Jan 13, 2025 candle High
- We had a candle body close above that gap and now its acting like support.
-Now i am expecting the bullish trend to continue and long term upside target is Jan 13, 2025 candle High and Short term upside target is April 7, 2025 candle high

US 10Y TREASURY: tariffs negotiationsAnother rollercoaster of US Treasury yields calmed down after the FOMC meeting held during the previous week. As expected, the Fed did not make any changes to the current levels of interest rates. However, in case that trade tariffs cause some harm to the US economy, the Fed is in position to react swiftly. The economy is still growing at a solid pace, as Fed officials see it, and the jobs market is relatively strong while the inflation is still on the target to reach gradually 2% in the coming period.
The 10Y US benchmark yields reached lowest weekly level at 4,26% and moved to the higher grounds in the after FOMC meeting trading. They have closed the week at the level of 4,39%. Markets will spend the week ahead by digesting the latest economic data and also April inflation which is due for the release on Monday. However, the US-China trade tariffs negotiations are expected to start soon, which might bring again some higher volatility and nervousness among investors and traders on the market. As per current charts, some relaxation in the 10Y yields is quite possible, however, the impact of news related to negotiations could impact moves to both sides.

Bond Yields moving soonSo, we redrew the trendlines a few days ago and this is where the 10Yr currently stands.
Bond Yields should give some sort of direction within the next handful of days. Be ready.
TVC:TNX
Interest Rates

US 10Y TREASURY: rollercoaster, againMarket movements in a previous period are clearly showing how high uncertainty is currently among market participants. The US Treasuries for one more time took the downtrend during the previous week, clearly testing the 4,2% level with 10Y US benchmark, but Fridays better than expected jobs report, was a trigger for a move back toward the higher grounds. The lowest weekly level of 10Y yields was 4,13% on Thursday, however, the rest of the trading week the market was looking at the upside. The strong move up, brought the 10Y yields toward the level of 4,30% where yields have closed the trading week.
The volatility might continue also during the week ahead. The FOMC meeting is scheduled for May 6-7th, while on Wednesday will be the interest rate decision day, and also Fed Chair Powell's address to the public. As per current market expectations, as posted by the CME Group FedWatch Tool, the Fed could leave interest rates unchanged at this meeting, considering stronger than expected jobs data posted during this week. In addition, the market is expecting that the Fed will not change interest rates until their meeting in July. At the same time, analysts are noting that it is too early to see the reflection of trade tariffs in real economy, concretely in jobs data, in which sense, they are taking precaution with current strong jobs data. In this sense, the Fed Chair Powell's speech, after the FOMC meeting will be closely watched by markets, for a standing of Fed on the current state of the US economy as well as their view on tariffs repercussions in the future period.

10 Yr Bond Yield breaks downtrend & then falls back into it!10 Yr Bond yields seem to have topped after that massive 1 week run. That was an impressive run! TVC:TNX
Even though the downtrend was broken, the 10Yr Yield put in a LOWER high.
We can also see that the recent uptrend was violated, back in a down trend.
Short term interest rates look worse!

Bull in a China Shop. The S&P 500 Index After 100 Days of TrumpPresident Donald Trump's first 100 days in office were the worst for the stock market in any postwar four-year U.S. presidential cycle since the 1970s.
The S&P 500's 7.9% drop from Trump's inauguration on Jan. 20 to the close on April 25 is the second-worst first 100 days since President Richard Nixon's second term.
Nixon, after taking office as President of the United States (for the second time) on January 20, 1973, witnessed the S&P 500 index fall by 9.9% in his first 100 days in office, due to the unsuccessful economic measures he took to combat inflation, which led to the recession of 1973-1975 when the S&P 500 index losses of nearly to 50 percent.
It all started in January 1973 in the best soap opera traditions of Wall Street, at the historical peaks of the S&P 500 index..
..But less than two years later it quickly grew into a Western with a good dose of Horror, because the scenario of a 2-fold reduction of the S&P 500 index was unheard those times for financial tycoons and ordinary onlookers on the street, since the Great Depression of the 1930s, that is, for the entire post-war time span since World War II ended, or almost for forty years.
Nixon later resigned in 1974 amid the Watergate scandal.
On average, the S&P 500 rises 2.1% in the first 100 days of any president's term, according to CFRA, based on data from election years 1944 through 2020.
The severity of the stock market slide early in Trump's presidency stands in stark contrast to the initial "The Future is Bright as Never" euphoria following his election victory in November, when the S&P 500 jumped to all-time highs on the belief that Mr. Trump would shake off the clouds, end the war in Ukraine overnight, and deliver long-awaited tax cuts and deregulation.
Growth slowed and then, alas, plummeted as Trump used his first days in office to push other campaign promises that investors took less seriously, notably an aggressive approach to trade that many fear will fuel inflation and push the U.S. into recession.
The S&P 500 fell sharply in April, losing 10% in just two days and briefly entering a bear market after Trump announced “reciprocal” tariffs, amid a national emergency that gave him free rein to push through tariffs without congressional oversight.
Then Trump began yanking the tariff switch back and forth, reversing part of that tariff decision and giving countries a 90-day window to renegotiate, calming some investor fears.
Many fear more downside is ahead.
Everyone is looking for a bottom. But it could just be a bear market rally, a short-term bounce of sorts.
And it's not certain that we're out of the woods yet, given the lack of clarity and ongoing uncertainty in Washington.
Time will tell only...
--
Best 'China shop' wishes,
@PandorraResearch Team

US 10Y TREASURY: NFP and jobs data ahead There has been another pullback in the 10Y US Treasury yields during the previous week. It comes as a result of investors' anticipation that the trade war between the US and China might soon be finalized. However, this sentiment is again based on mixed signals coming from the US Administration during the previous week. What will be the final result, no one actually knows, not even the US Administration, as per some analysts. The US President is still putting pressures on Fed Chair Powell to lower interest rates, which he noted on several occasions in interviews.
Anyway, the data show that the 10Y US yields started the previous week around 4,42% and dropped during the rest of the week to the Fridays level of 4,25%. Certainly, as long as the US Administration is using the push-and-pull strategy regarding trade tariffs, the market volatility will continue. And it is not only the US Treasury bond market, but also prices of equities and gold. As per technical analysis, the 4,2% level is the supporting level for the 10Y yields, which will be tested again in the week ahead. Still, it should be considered that the US NFP and jobs data will be released, where Friday is again day to closely watch, as it might bring for one more time a surprisingly volatile trading day.

The relationship between gold, copper and the US10YFirst, can you tell me what you think the relationship between these two curves is? Clearly, these two curves have a strong negative correlation, meaning they move exactly opposite to each other. You can see in the image that their behavior is like a mirror image (from 2007 to before 2022).
You are familiar with the gold-to-copper ratio, right? Now, when this gold-to-copper ratio curve rises, it means that gold is giving better returns compared to copper. This indicates that the global economy is moving away from growth and heading toward a recession. Investors, instead of investing in production (where copper symbolizes production), choose to invest in a safe haven like gold. The opposite happens when this curve goes down.
The lower curve represents the yield on long-term U.S. bonds. When this curve is rising, it means that the supply of bonds is greater than the demand. People are selling bonds, which causes the bond yield to rise. When the curve is falling, it means people are buying bonds, which causes the bond yield to drop.
Why do these two curves move in opposite directions?
Now, let’s get to the main question. The answer to this question is simple: bonds, like gold, serve as a safe haven for investors. When the economy moves toward a recession (when gold offers better returns than copper, and the gold-to-copper ratio is rising), some investors shift towards bonds, and the yield curve drops. That’s why these two curves move in opposite directions.
To summarize the entire story: Movement toward recession = investors moving toward gold and bonds = rise in the gold-to-copper ratio and drop in bond yield curve.
Now it’s clear why these two curves move opposite to each other. The big surprise is coming👇
Since the beginning of 2022, the historical trend has changed. These two curves have started to show a positive correlation! Meaning, everything I mentioned above has gone out the window! Now, the question is: What suddenly happened? There are several analyses, but I believe what changed is that U.S. bonds are no longer a safe haven for investors, as they once were (the same fear signal I mentioned earlier). In fact, after the pandemic, the world has never been the same. This is an important development and it affects many things. I’ve addressed this topic from various perspectives before, and here’s a new angle on it.
For the past two to three years, contrary to the historical trend, investors have been buying gold but selling bonds, and these two curves have been rising together.
As you can see, the analytical situation has changed drastically compared to, say, 10 years ago, and many fundamental facts have shifted. For instance, many people expect the Federal Reserve to lower interest rates and gold to go up again, but after an initial short shock, the story will probably reverse.
#Gold #XAUUSD #HG1!
