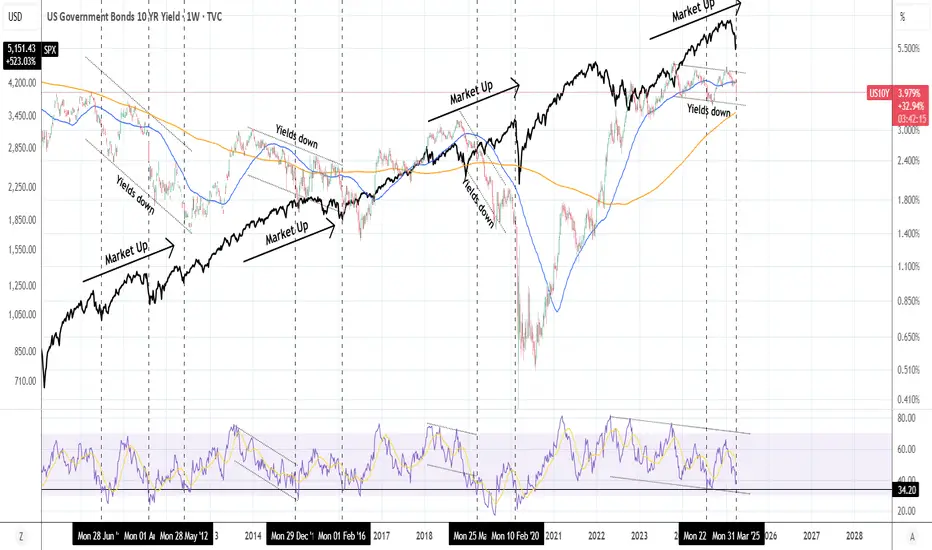
US10Y: This pattern has been extremely bullish for stocks.The U.S. Government Bonds 10 YR Yield is heavily bearish on its 1W technical outlook (RSI = 36.788, MACD = -0.034, ADX = 32.176) and that has historically been favorable for stocks. More specifically, when the Yields have been trending down inside a Channel Up since 2010, the S&P500 was on an uptrend. Going into more detail on the US10Y RSI on the 1W timeframe, it is almost on the 34.20 trendline, which is a key level as every time it hit that (see the dashed vertical lines), the S&P500 bottomed. The exception to the rule was, needless to say the COVID crash in Feb 2020. According to this, Trump's tariffs create the perfect market opportunity for a new long term buy.
## If you like our free content follow our profile to get more daily ideas. ##
## Comments and likes are greatly appreciated. ##
Us10year
My Current View On The 1hr With No ReasonI like what I have and I even sell what I have! 😮 I like dollars maybe I am just some American that thinks in dollars in my wallet..🤑.. Its all fun and Games Until you start losing your bag.💰..
"Count the coin not the dollars" I say to myself while listening knowing well I am my worst enemy. 🎶
In this market cycle it is out to bite you! Anything given will quickly look to take it back including you.. Nothing is a given be ready to fight and beg for what you hold back be it coins or dollars.....
"One coin to rule them all until there is wait two or three... Oh wait there's another one!!!"
YOLO Moonboyz 🌛 If you feel so inclined to do so.
🚽👄 Toilet Mouth: "Why do all your post say Short!?" or a bunch of "BUT, BUT, BUT"
⭐Not my job to tell you to buy or sell entries matter to most I only care about my exits.
⭐Let each person determine their cost to acquire and choice to play or not.
No Advice to give just thoughts that I can't shake after the last 8 years in the world of "CRYPTO"
Things 🤷♂️ #Fixed IDK!
🙏FOR JUST A HEALTHLY PULLBACK!
""KEEP CALM AND MANAGE THY RISK & BALANCE your Senses!""
I am The CoinSLayer 👨💻😈
You have been warned by The Coin SLayer!
P.S. Now witha bag!
P.S.S. well two or Ten

US10Y: Rejection at the top of the 1W Channel Down. Prime short.The U.S. Government Bonds 10 YR Yield may still be bullish on its 1W technical outlook (RSI = 59.113, MACD = 0.016, ADX = 38.613), but this week's candle is getting rejected at the top of the 1 year Channel Down. If it closes in red it will be the first in almost 2 months and a clear technical signal that a bearish reversal has started. The 1W RSI has also started to reverse. As a consequence, we are turning bearish on the US10Y as of now, targeting the 1.1 Fibonacci extension (TP = 3.480) where the previous LL was formed.
## If you like our free content follow our profile to get more daily ideas. ##
## Comments and likes are greatly appreciated. ##

$US10Y Bull Flag on the weekly TVC:US10Y Bull Flag on the weekly chart, its bullish until it fails. Interest rates going higher will be a problem for stocks like NASDAQ:AAPL NASDAQ:GOOGL NASDAQ:MSFT NASDAQ:META

US 10 Year Yield On The Cusp of Breaking DownThe 10 Year Yield has been trying to hold this B point level as Support for the longest time but everytime it tries to bounce it gets pushed right back down and in the most recent try we saw it come up to test the moving averages while it Bearishly Diverged and began a Death Cross. If we can get a serious BAMM Breakdown from here it coulkd go down all the way to 1.4% which would likely coincide with a huge decline in the DXY and a rise in the stock market.

USA need to cover chart and US10Y told us why?As we can see on chart long term dynamic trend line broke and after a short correction on US10Y, we should be ready to bull run up to 5% and that is a top range of long time coverage for US10Y, Hope not to see more up and I think we will start another range time box as shown.
Boxes 1 and 2; some how have same time range but most of time the chart fluctuated in range boxes 3 ( range 3.1% to 5.6%) and I think it is time to start another range box 3 ?!

Bond Market Rallies After Inflation DataBonds have soared after yields collapsed due to CPI coming in slightly better than expected. This follows months of consistently high readings fueling a hawkish Fed. With this reading, the markets will likely start to anticipate a pivot to a less hawkish stance. ZN broke through our target of 110'27, and moved a full handle above that to 111'26. It is currently meeting resistance at 111'29 or so, where a red triangle on the KRI is confirming resistance. Watch for ZN to equilibrate as the news gets priced in. If we can keep going then 113'12 is the next target, otherwise, 110'27 should give support.

US10Y Huge Bearish Divergence on RSI calls a drop!The U.S. Government Bonds 10YR Yield formed Lower Highs on its 1D RSI while the price action has been trading on Higher Highs. This is a major Bearish Divergence that technically calls for a price reversal to the downside.
What's even more interesting is that every time the same RSI Bearish Divergence has been formed in the past 12 months, the US10Y always pulled-back and hit its 1D MA50 (blue trend-line). This is currently at 3.563 (and rising).
A reversal on the bond yields can have a major impact on the financial markets, especially ahead of next week's Fed Rate Decision, as it is negatively correlated with stocks and Gold.
-------------------------------------------------------------------------------
** Please LIKE 👍, SUBSCRIBE ✅, SHARE 🙌 and COMMENT ✍ if you enjoy this idea! Also share your ideas and charts in the comments section below! This is best way to keep it relevant, support me, keep the content here free and allow the idea to reach as many people as possible. **
-------------------------------------------------------------------------------
You may also TELL ME 🙋♀️🙋♂️ in the comments section which symbol you want me to analyze next and on which time-frame. The one with the most posts will be published tomorrow! 👏🎁
-------------------------------------------------------------------------------
👇 👇 👇 👇 👇 👇
💸💸💸💸💸💸
👇 👇 👇 👇 👇 👇

Bond Market Reacts to Nonfarm and FedBonds fell again, hitting our next target at 115'29. Yields are creeping up as the markets are pricing in the next rate hike, expected to be 50-75 bps . Nonfarm payrolls gave us some insight into economic conditions: unemployment rose to 3.7%, with a headline miss and downward revision. This suggests that the economy is weakening further, and we are in a period of stagflation. Yields subsequently weakened and we are seeing a slight pivot off 1529. If we rally, we could hit 116'20 or even 117'08. If the figures are hotter than expected it should bolster the Fed's hawkish rhetoric and we could break through 115'29, to 115'03.

Bond Yieds RiseBonds have fallen further, breaking down past 119'01 into the vacuum zone below. We are still hovering above 118'04, the next level of support, but the Kovach OBV is looking pretty bearish. We are starting to see some green triangles on the KRI around 118'20, but we should have strong support at 118'04 if current levels do not hold. If we can pivot, then 119'01 should provide resistance.

US10Y Testing the 1D MA50 againThe U.S. Government Bonds 10 YR Yield (US10Y) has been on a pull-back in the past 2 weeks and is close to testing the 1D MA50 (blue trend-line) again. This held last time upon contact on May 26 and constitutes the first Support. We may have a Channel Up pattern in formation and the 1D MA50 sits almost exactly on its Higher Lows (bottom) trend-line. A 1D candle close below it, could open the way for the greater and much anticipated technically correction to the 1D MA200 (orange trend-line) which is untouched since December 29 2021.
That also sits currently on the Higher Lows trend-line that started after the December 20 2021 Low. If the Channel Up is validated again though, there are currently higher probabilities to see the bullish trend extending back to the 3.500 Resistance and if the 3.0 Fibonacci extension on the Channel breaks, aim the 3.5 Fib ext level. Notice how well of a buy entry the 1D RSI's Higher Lows trend-line has been since July 16 2021.
--------------------------------------------------------------------------------------------------------
Please like, subscribe and share your ideas and charts with the community!
--------------------------------------------------------------------------------------------------------

Dead Cat Bounce for Bonds?Bonds have pressed higher following the Fed's 75bps rate hike. We have broken out of 115'29 back into the 116 handle, topping out at our level at 116'20. A red triangle on the KRI suggests that we are facing resistance here. We do appear to be seeing a bull wedge consolidation pattern, but the Kovach OBV has leveled off, so it is likely we will fall from here. Watch 115'29 or 115'03 for support. If we are able to break out further, the next target is 117'08.

US10Y Slowly upwards to the end of year, huge rejection after.The U.S. Government Bonds 10 YR Yield (US10Y) has been trading within a Bearish Megaphone with Higher Highs and Lower Lows since late 2013. The current 1W RSI pattern resembles that of the price Channel Up that in 1 year led to the most recent Higher High in 2018.
As a result, we expect a slow Channel Up towards the end of 2022/ early 2023, which will add to the current stock market uncertainty/ volatility, but then strong bearish reversal, if the Higher Highs trend-line/ top of the Megaphone holds. That can fuel a strong bullish reversal on the stock market (S&P500 index displayed in blue on this chart), as it happened in 2019.
--------------------------------------------------------------------------------------------------------
** Please support this idea with your likes and comments, it is the best way to keep it relevant and support me. **
--------------------------------------------------------------------------------------------------------

US10Y Aggressive correction possibleThe U.S. Government Bonds 10 YR Yield (US10Y) has been trading within a short-term Channel Down on the 1D time-frame with the 4H MA100 (red trend-line) as the Resistance and the 1D MA50 (blue trend-line) as the Support. This is turning into a tight squeeze and whatever level breaks first, should give us the direction on the longer term.
A break below the 1D MA50 can see the price correct aggressively by filling the gaps on the lower MA levels, the 1D MA100 (green trend-line) and eventually the 1D MA200 (orange trend-line). In that case the 0.618 Fibonacci retracement level would be a fair target. This resembles so far the correction of April - July 2021, which bottomed below the 1D MA200.
On the other hand, I expect a bullish extension if the 3.205 High breaks towards the -0.236 Fib.
--------------------------------------------------------------------------------------------------------
** Please support this idea with your likes and comments, it is the best way to keep it relevant and support me. **
--------------------------------------------------------------------------------------------------------

Joe Gun2Head Trade - US 10 Year Yield topping out?Trade Idea: US 10 Year Yield topping out?
Reasoning: Head and shoulders top on the hourly chart
Entry Level: 2.842
Take Profit Level: 2.617
Stop Loss: 2.922
Risk/Reward: 2.81:1
Disclaimer – Signal Centre. Please be reminded – you alone are responsible for your trading – both gains and losses. There is a very high degree of risk involved in trading. The technical analysis , like all indicators, strategies, columns, articles and other features accessible on/though this site is for informational purposes only and should not be construed as investment advice by you. Your use of the technical analysis , as would also your use of all mentioned indicators, strategies, columns, articles and all other features, is entirely at your own risk and it is your sole responsibility to evaluate the accuracy, completeness and usefulness (including suitability) of the information. You should assess the risk of any trade with your financial adviser and make your own independent decision(s) regarding any tradable products which may be the subject matter of the technical analysis or any of the said indicators, strategies, columns, articles and all other features.

Breakout Of the 40 Years Old DowntrendUS 10 year bond rates are important indicator for investors.
If its go up, it means investors are selling their bonds expecting interest rate rise from FED.
This is happening for over 1.5 year now.
Investors are selling bonds because they think inflation coming and FED will act accordingly.
High interest rates cause risky assets, like crypto and stock market, to lose value.
In this Monthly chart,
Something huge is happening with the 10 years right now.
We were in a downtrend that started in 1981.
We tested the trendline in 1984, 2007, 2018 but never able to break it out.
Last months, breakout occured and we may retest the trendline before going up.
Around 3.25 area seems to have a strong resistance.
Also around 3.25 area, investors may want to buy bonds therefore 10y rates can pause their rise for a couple of months.
The breakout of this decades long trendline may mean that, we entered a new period of high interest rates.
But in the end everything will be decided by FEDs actions.
Thanks.
Follow for more information and charts about markets and global economy.

10 YEAR YIELD GOING HIGHER MOST LIKELYIn the current high inflation environment we are in and with the Rus-Ukr war pushing energy and other commodity prices higher and higher, we can all agree yields on bonds have every right to move way higher then we have been seeing the past few years.
The peak of the 'Tamper-Tantrums' back in November 2018 (Seen with black arrow) we can see the 10 year yield was higher than current levels. This was also when the fed wasn't that eager to release a 9 trillion dollar balance sheet back to market and when inflation levels were no where near what we are seeing (and feeling...) today.
I do think we could be seeing the 10Y yield trying those levels (hit a little over 3% during those times) in the upcoming weeks. I do think the market will be ahead of the Fed, and push it to move higher faster. We may even break the 3% level.. especially if there is a hyper-inflation panic.
Faster Bond movements could drag the market down (especially high flyers, tech stocks, etc) as e have seen in the recent past.
We had a 2y/10y inversion last week which could be a leading recession indicator. In any case, be sure it's the Bond markets that will be setting the tone.
Trade with caution :)

Will the Bond Market Continue to Sell Off??Bonds have reached a relative high at 123'01 to the tick then promptly rejected this level. A red triangle on the KRI confirmed resistance and we headed straight back down to through the 122 handle to finally find support at 121'28. We are currently seeing some support here, confirmed by a green triangle on the KRI. However the Kovach OBV has taken a steep dive south suggesting the bear rout is about to pick up again. If so, the next target is 121'00, then 120'14. If we are wrong, we must break through 123'01 before we can consider higher levels.

The US Bond Market Explained.
You will hear many people in finance and in trading tell you that the bond market is the most important market to understand because it influences every other market in the world… particularly the US Bond market.
In this video I am going to try and explain what the Bond market is for anyone new to trading or still learning about the bond market and then I will give you a prediction of where I think the market is moving next.
All within 20 minutes because that’s the limit on TradingView videos.
I will try to keep the terminology as simple as possible and jargon free for people still learning about this market but if at all you want any further explanation on anything covered, simply drop a comment below and I will do my best to answer them all.
Basics
- Two main elements to the bond market…
1) Bond prices “Called a premium”, simply, this is the price you pay to buy a bond.
2) Bond Yields. These are how much interest you are paid on that bond and are described in percentage terms.
As with any asset price, the prices of bonds are largely determined by supply and demand forces.
Typically, investors buy more bonds (and demand goes up) when the economy is projected to perform badly because bonds are regarded as one of the safest assets in the market.
&
Investors sell more bonds when they expect the economy to do well because they want to use that money to buy riskier assets such as stocks that will provide better returns in the economic good times.
These two elements in bonds are INVERSELY CORRELATED.
So when the Bond price goes up, the yield on offer goes down.
&
when the bond prices go down, the yield goes up.
Finally the last basic point to explain for anyone new to trading or the bond market is that the duration of the bond is also important to consider when analysing the bond market.
The most common bond is the 10YR but there’s also 30YR bonds and 1YR bonds available and the duration of the bond is the amount of time that the “premium” is locked up for… after the duration the premium is then paid back to the investor.
Each of these bonds durations perform differently depending on investors sentiments.
So hopefully that has given a brief overview of what the bond market is and explained the basics of how it works.
In the video above I explain the next steps that the bond market may have including projection 10YR yields of 3% or more to come! And the potentially dangerous consequences that could have for markets.

US10 yrs yield VS Gold. 1.00 first then 2.00? 23/8/21I'm currently viewing US10 years bond yield as a "gauge" for negative correlation for Gold market instead of equity index e.g. SPX . As their correlation efficient rate now is about 80% ...And we might see 1 more leg up in US10 years Bund toward around 2.000 to complete last leg of tripe zig zag wave which is wave (Z) (Cyan /Light Blue)... So we might have 1 more leg down for Gold till around 24 Sept 2020..


Chart of the day: Surprising push lower in US10Y continues...The recent economic data out of the US was nothing short of spectacular, with ISM Mfg PMI printing at the highest level since 1983, with NFP showing close to a million jobs gained in March and ISM Services PMI printing the highest number going back as far as our dataset allows.
These types of numbers were a very good example of the type of solid economic beats that market participants are expecting going into Q2. It’s also solid prints like these that are expected to see US10Y pushing higher.
However, despite the data, US10Y has been pushing lower over the past few sessions, currently meandering close to the next key area of support between 1.60 – 1.62.
So, what to make of this drop in US10Y? For now, not much as the med term bias remains tilted to the upside for yields, especially going into the second quarter of the year. What would change that med term view?
Firstly, a drastic deterioration in the actual Q2 data which sees the market second guess it’s baseline assumptions. Secondly, a drastic deterioration in the virus situation, bad enough to overshadow the current flurry of positive drivers in the market right now.
Thus, the expectation for higher yields in the med term remains intact and we are looking at key support zones (1.60 – 1.62 and 1.50 – 1.52) as possible areas where we could expect med term bond sellers to step back in.

US10Y: U.S. 10 Year Treasury (Does inflation eat money?)There are two channels in a row on the chart. One of them is the Fibonacci Channels, while the horizontal ones are the Fibonacci Retracement.
The overlapping point of these two channels is 1.93% and we predict that we will reach this point in a short time.
Of course, we don't say this just by looking at the lines on the graph. With the latest incentive package, the money that will flow to the markets is obvious, and everybody says that inflation is coming. Growth in the US will be very strong, and this will inevitably result in deferred demand turning into a buying act ...
It contains only personal views and opinions. Does not contain legal investment advice ...
