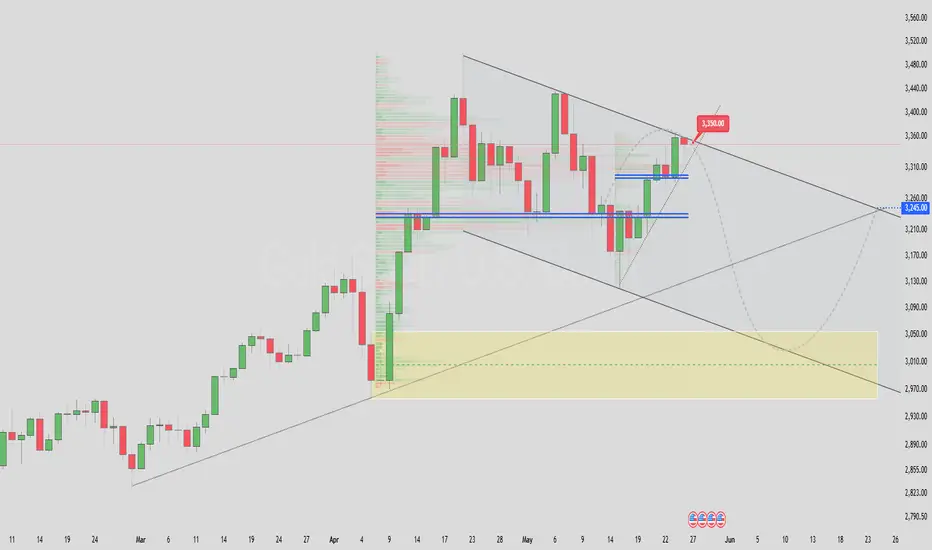
Gold Price Forecast: May - June 2025Gold is currently trading at $3,345.02. The recommendation is to sell now, targeting a bearish move down to $3,050. This outlook is supported by the formation of a rising wedge pattern in confluence with a 3rd retest on the daily chart, a technical setup that often signals a downward price movement. After reaching the target of $3,046, expect a retracement back to $3,242, where the price is likely to retest the long-term bullish trend.
US30
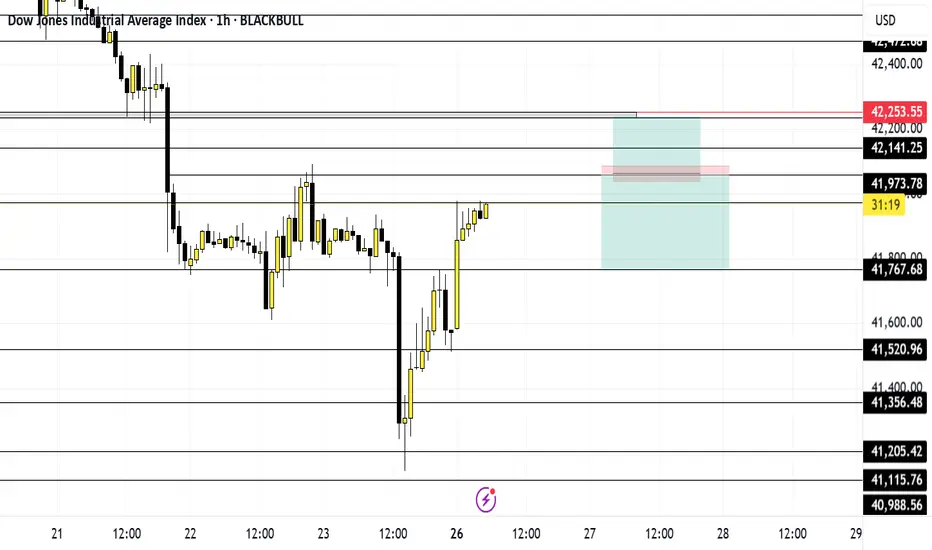
May 26 US30Let's get to work... Price at the moment is trending down, creating lower highs and lower lows on the 4hr. However it broke structure on the 1hr and is trending upward.
I'm going to wait for price to get to 42,055 level and wait for it to break and retest for a buy or break structure for a sell.
Caution. Monday is a holiday so I most likely won't trade until Tuesday.
And ultimately whichever way price goes I'm going to get out at my net key level.
Have fun, stay safe and enjoy your journey
US30 Is Going Down! Sell!
Here is our detailed technical review for US30.
Time Frame: 9h
Current Trend: Bearish
Sentiment: Overbought (based on 7-period RSI)
Forecast: Bearish
The market is approaching a significant resistance area 41,575.9.
Due to the fact that we see a positive bearish reaction from the underlined area, I strongly believe that sellers will manage to push the price all the way down to 40,381.8 level.
P.S
We determine oversold/overbought condition with RSI indicator.
When it drops below 30 - the market is considered to be oversold.
When it bounces above 70 - the market is considered to be overbought.
Disclosure: I am part of Trade Nation's Influencer program and receive a monthly fee for using their TradingView charts in my analysis.
Like and subscribe and comment my ideas if you enjoy them!

"US30/DJI" Index Market Bullish Robbery (Swing Trade Plan)🌟Hi! Hola! Ola! Bonjour! Hallo! Marhaba!🌟
Dear Money Makers & Robbers, 🤑 💰💸✈️
Based on 🔥Thief Trading style technical and fundamental analysis🔥, here is our master plan to heist the "US30/DJI" Index Market Heist. Please adhere to the strategy I've outlined in the chart, which emphasizes long entry. Our aim is to escape near the high-risk YELLOW MA Zone. It's a Risky level, overbought market, consolidation, trend reversal, trap at the level where traders and bearish robbers are stronger. 🏆💸"Take profit and treat yourself, traders. You deserve it!💪🏆🎉
Entry 📈 : "The vault is wide open! Swipe the Bullish loot at any price - the heist is on!
however I advise to Place buy limit orders within a 15 or 30 minute timeframe most recent or swing, low or high level. I Highly recommended you to put alert in your chart.
Stop Loss 🛑:
Thief SL placed at the Nearest / Swing low level Using the 3H timeframe (39200) Day/Swing trade basis.
SL is based on your risk of the trade, lot size and how many multiple orders you have to take.
🏴☠️Target 🎯: 42400
💰💵💸"US30/DJI" Index Money Heist Plan is currently experiencing a bullishness,., driven by several key factors. .☝☝☝
📰🗞️Get & Read the Fundamental, Macro Economics, COT Report, Geopolitical and News Analysis, Sentimental Outlook, Intermarket Analysis, Index-Specific Analysis, Future trend targets with Overall outlook score... go ahead to check 👉👉👉🔗🔗🌎🌏🗺
⚠️Trading Alert : News Releases and Position Management 📰🗞️🚫🚏
As a reminder, news releases can have a significant impact on market prices and volatility. To minimize potential losses and protect your running positions,
we recommend the following:
Avoid taking new trades during news releases
Use trailing stop-loss orders to protect your running positions and lock in profits
💖Supporting our robbery plan 💥Hit the Boost Button💥 will enable us to effortlessly make and steal money 💰💵. Boost the strength of our robbery team. Every day in this market make money with ease by using the Thief Trading Style.🏆💪🤝❤️🎉🚀
I'll see you soon with another heist plan, so stay tuned 🤑🐱👤🤗🤩

DOW JONES Inverse Head and Shoulders starting new rally.Dow Jones/ US30 has found support today on its 1day MA50 despite the strong correction.
The long term pattern is an Inverse Head and Shoulders and today's 1day MA50 hold may complete its Right Shoulder.
Go long and target the 2.0 Fibonacci extension at 50000.
Follow us, like the idea and leave a comment below!!

US30: Move Up Expected! Long!
My dear friends,
Today we will analyse US30 together☺️
The in-trend continuation seems likely as the current long-term trend appears to be strong, and price is holding above a key level of 41,589.0 So a bullish continuation seems plausible, targeting the next high. We should enter on confirmation, and place a stop-loss beyond the recent swing level.
❤️Sending you lots of Love and Hugs❤️

US30 BULLISH BIAS RIGHT NOW| LONG
US30 SIGNAL
Trade Direction: long
Entry Level: 41,822.1
Target Level: 42,718.6
Stop Loss: 41,224.4
RISK PROFILE
Risk level: medium
Suggested risk: 1%
Timeframe: 9h
Disclosure: I am part of Trade Nation's Influencer program and receive a monthly fee for using their TradingView charts in my analysis.
✅LIKE AND COMMENT MY IDEAS✅

Dow Jones Index (US30): Time to Grow
As I predicted yesterday, US30 nicely respected
a wide daily support cluster.
A pullback from that is now confirmed with a violation
of a minor horizontal resistance on a 4H.
The index may reach 42200 level soon.
❤️Please, support my work with like, thank you!❤️
I am part of Trade Nation's Influencer program and receive a monthly fee for using their TradingView charts in my analysis.

Potential bearish drop?Dow Jones (US30) is rising towards the pivot, which lines up with the 61.8% Fibonacci retracement and could drop to the 1st support.
Pivot: 42,435.88
1st Support: 41,294.81
1st Resistance: 43,025.39
Risk Warning:
Trading Forex and CFDs carries a high level of risk to your capital and you should only trade with money you can afford to lose. Trading Forex and CFDs may not be suitable for all investors, so please ensure that you fully understand the risks involved and seek independent advice if necessary.
Disclaimer:
The above opinions given constitute general market commentary, and do not constitute the opinion or advice of IC Markets or any form of personal or investment advice.
Any opinions, news, research, analyses, prices, other information, or links to third-party sites contained on this website are provided on an "as-is" basis, are intended only to be informative, is not an advice nor a recommendation, nor research, or a record of our trading prices, or an offer of, or solicitation for a transaction in any financial instrument and thus should not be treated as such. The information provided does not involve any specific investment objectives, financial situation and needs of any specific person who may receive it. Please be aware, that past performance is not a reliable indicator of future performance and/or results. Past Performance or Forward-looking scenarios based upon the reasonable beliefs of the third-party provider are not a guarantee of future performance. Actual results may differ materially from those anticipated in forward-looking or past performance statements. IC Markets makes no representation or warranty and assumes no liability as to the accuracy or completeness of the information provided, nor any loss arising from any investment based on a recommendation, forecast or any information supplied by any third-party.

Hanzo / US30 15m Path ( Confirmed Breakout Zones )🆚 US30
The Path of Precision – Hanzo’s Market Strike
🔥 Key Levels & Breakout Strategy – 15M TF
☄️ Bearish Setup After Break Out – 41750 Zone
Price must break liquidity with high volume to confirm the move.
☄️ Bullish Setup After Break Out – 41950 Zone
Price must break liquidity with high volume to confirm the move.
🩸 15M Time Frame Confluence
————
CHoCH & Liquidity Grab @ 41820
Key Level / Equal lows Formation - 41600
Strong Rejection from 42000 – The Ultimate Pivot
Strong Rejection from 41450 – The Ultimate Pivot
🔥 1H Time Frame Confirmation
Twin Wicks @ 41750 – Liquidity Engineered
Twin Wicks @ 41450 – Liquidity Engineered

US30/Dow Jones Trade IdeaThis is what I believe could be cooking up currently on US30... A possible buyers control might be coming up the coming days as it looks like price is possibly heading for HTF FVG.
Remember this is just a trade idea and nothing is completely guaranteed to play out the way I'm anticipating... Following this trade idea will be on your own risk!
#us30 #dowjones #indices #nasdaq #german30 #dax

DOW JONES INDEX (US30): Your Plan to Buy Explained
There is a high chance that US30 will resume growth soon.
The index is currently testing a wide daily support cluster.
My signal to buy will be a bullish violation and a candle close above
41920 minor horizontal resistance.
A bullish movement will be anticipated at least to 42200 level then.
❤️Please, support my work with like, thank you!❤️
I am part of Trade Nation's Influencer program and receive a monthly fee for using their TradingView charts in my analysis.

Dow Jones Short Term Sell Trading PlanM15 - Strong bearish momentum
Lower lows on the moving averages of the MACD indicator.
Until the two Fibonacci resistance zones hold I expect the price to continue lower further.
If you enjoy this idea, don’t forget to LIKE 👍, FOLLOW ✅, SHARE 🙌, and COMMENT ✍! Drop your thoughts and charts below to keep the discussion going. Your support helps keep this content free and reach more people! 🚀
--------------------------------------------------------------------------------------------------------------------
Disclosure: I am part of Trade Nation's Influencer program and receive a monthly fee for using their TradingView charts in my analysis.

Risk-Off Mode: Indices Under Pressure, VIX Breakout in Play!🌍 Indices Under Pressure as Volatility Spikes – Market Analysis (May 22, 2025) 🚨
My TradingView multi-chart workspace is tracking major global indices alongside the VIX (bottom right). The visual tells the story: broad-based selling is hitting equities, and the VIX is on the rise, signaling a clear risk-off environment.
Key Observations:
Indices in the Red:
All major indices in my workspace are under pressure, with sharp declines across the S&P 500, NASDAQ, Dow, DAX, and others. This aligns with today’s global heatmaps, which are flashing red across sectors and regions. The selling is broad, not just isolated to tech or cyclicals.
VIX Volatility Index Elevated:
The VIX (CBOE Volatility Index) is spiking, up over 15% today and holding above the 20 level (FXEmpire). This “fear gauge” confirms that traders are hedging aggressively and bracing for more turbulence. Historically, a rising VIX alongside falling indices is a classic sign of heightened uncertainty and potential for further downside.
Macro & Geopolitical Backdrop:
The selling pressure is fueled by persistent US-China trade tensions, new tariffs, and a lack of clear central bank support. The White House remains firm on its trade stance, while the Fed is not signaling imminent rate cuts (VT Markets). This policy vacuum is amplifying volatility and risk aversion.
Global Sentiment:
Asian and European markets are also deep in the red, with historic single-day losses in some indices. The “Magnificent Seven” US tech stocks have entered bear market territory, and even traditional safe havens like gold are seeing some liquidation as investors scramble for cash.
What’s Next?
Short-Term Outlook:
With the VIX elevated and indices breaking key support levels, expect continued choppiness and possible further downside. Macro data releases and any shift in trade rhetoric will be key catalysts. Defensive positioning and risk management are crucial in this environment.
Potential for Rebound:
If we see a de-escalation in trade tensions or dovish signals from central banks, a relief rally is possible. But for now, the path of least resistance appears lower, with volatility likely to remain high.
Summary:
The charts don’t lie – indices are under heavy selling pressure, and the VIX is confirming a risk-off mood. Stay nimble, watch for headline risks, and be prepared for more volatility in the days ahead. 📉🟥⚡

Dow Jones INTRADAY supported at 41900Geopolitical Risk: Oil prices spiked after CNN reported Israel may strike Iran’s nuclear sites, increasing market uncertainty. No final decision confirmed yet.
Rising geopolitical tension could weigh on risk sentiment and equities.
Safe-Haven Moves: The Swiss franc and Japanese yen strengthened as investors moved to safety. Reflects cautious tone in global markets, possibly limiting upside for equities.
Morgan Stanley View: Strategists recommend “Buy America” – but not the US dollar, hinting at confidence in US assets (e.g., stocks), while expecting further USD weakness.
Bond Market Shift: Traders expect long-term US bond yields to rise, which could pressure tech and growth stocks in equity indexes like the Nasdaq.
UK Inflation Watch: UK inflation data expected to tick higher — adding to global inflation and rate hike concerns, which may influence market mood.
Trading Outlook:
US equity indexes may open mixed to cautious. Geopolitical risks and rising yields could create headwinds, especially for rate-sensitive sectors. Watch for oil-driven inflation fears, bond yield movements, and shifts in safe-haven flows.
Key Support and Resistance Levels
Resistance Level 1: 42950
Resistance Level 2: 43370
Resistance Level 3: 43630
Support Level 1: 41900
Support Level 2: 41500
Support Level 3: 41200
This communication is for informational purposes only and should not be viewed as any form of recommendation as to a particular course of action or as investment advice. It is not intended as an offer or solicitation for the purchase or sale of any financial instrument or as an official confirmation of any transaction. Opinions, estimates and assumptions expressed herein are made as of the date of this communication and are subject to change without notice. This communication has been prepared based upon information, including market prices, data and other information, believed to be reliable; however, Trade Nation does not warrant its completeness or accuracy. All market prices and market data contained in or attached to this communication are indicative and subject to change without notice.

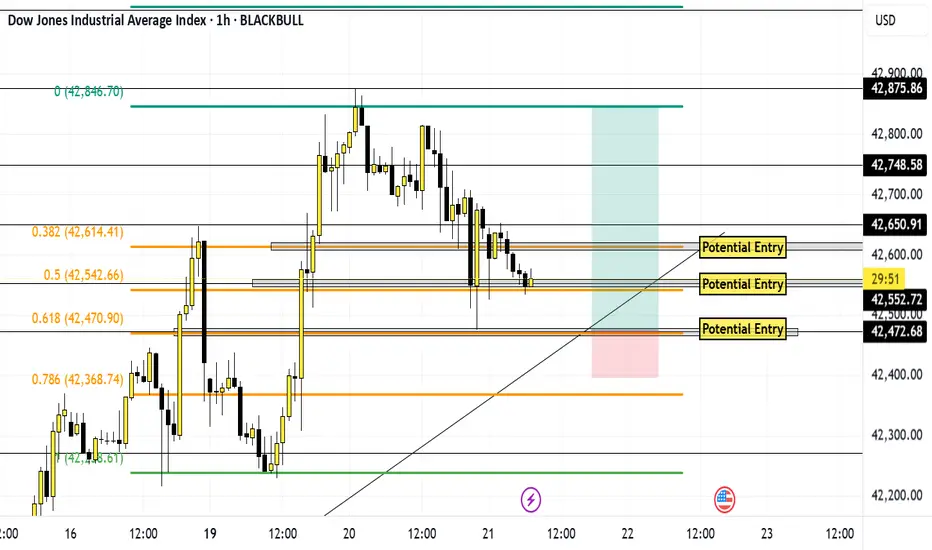
US30 May 21 If athletes get athlete's foot, what do elves get? Mistle-toes.
Now let's get to it. Before heading into the trade, I am definitely bullish. Price seems to be making a retracement before it pushes back up. I have given myself 3 potential entry points. But I am only going to enter them if:
Price makes market structure
Price breaks and retests through a key level/ entry point
If it bounces off of the trend line
Or a break of structure
And all of this, for me has to happen around 12pm est because I like to trade the afternoon session. But like a stallion price is going to do whatever it wants.
Stay safe and be patient
DOW JONES new Bull Cycle has started.Dow Jones / US30 has now crossed above its 1week MA50 and has restored the long term bullish trend.
That trend was in risk of getting invalidated but last month's rebound at the bottom of the long term Channel Up and holding Support A, kickstarted the new Bull Cycle.
Every Support A rebound inside this Channel Up technically started a new Bull Cycle.
The less aggressive of those was +57.76%.
This is where long term investors buy and target 57700.
Previous chart:
Follow us, like the idea and leave a comment below!!

US30: Bears Are Winning! Short!
My dear friends,
Today we will analyse US30 together☺️
The price is near a wide key level
and the pair is approaching a significant decision level of 42,703.0 Therefore, a strong bearish reaction here could determine the next move down.We will watch for a confirmation candle, and then target the next key level of 42,646.1.Recommend Stop-loss is beyond the current level.
❤️Sending you lots of Love and Hugs❤️

XAUUSD BULLISH OR BEARISH DETAILED ANALYSISXAUUSD is showing a textbook technical reaction from a well-defined support zone around the 3145–3170 range, which aligns perfectly with previous structure and demand zones. After a sharp retracement from recent highs, gold is now posting a strong bullish bounce, validating this level as a significant area of buyer interest. With today’s push above 3230, this bounce confirms our bullish thesis, and I now expect a continuation move toward the 3500 mark in the coming weeks.
Fundamentally, gold remains one of the most favored assets in 2025 due to ongoing global economic uncertainty, rising geopolitical risks, and persistent central bank demand. With US inflation cooling and the Fed signaling the potential for rate cuts later this year, real yields are slipping, giving gold the macro tailwind it needs to push higher. Moreover, recent data from China shows continued accumulation of gold reserves, reinforcing the long-term bullish case.
Technically, this correction appears to be a healthy retest in a strong uptrend. The market has respected the previous breakout level, and we are seeing early signs of momentum returning. The price action is starting to structure higher lows, and if price clears the 3250 level convincingly, it will likely trigger further momentum-based buying. I’m targeting 3500 as the next major resistance, where we could see some profit-taking.
This setup is one of the cleanest long opportunities on the board. With institutional positioning still net long, and technical and macro alignment pointing higher, I see this as a high-conviction trade. As long as price holds above 3145, the path of least resistance remains up. I’ll be closely watching for further confirmation as we build toward the 3500 target.

US30 Breakdown May 19thWhy shouldn't you write with a broken pen? Because it's pointless. Just like your life if you don't stay focused on your purpose. Ok let's get to work!
Price is on a beautiful uptrend and right now it's on a retracement down to 42650 area. I believe price will continue to push up to the 42870 Level.
How I'll enter
I am going to wait for price to get down to the 42650 level
Wait for a break of structure as confirmation for a buy (on a 1min)
Then Buy
But like my ex, price does whatever it wants, so be careful and always wait for a break and retest or a break of structure near the key areas.
Have fun. And trade responsibly

DOW JONES: Looks to extend gains to 43,500Dow Jone remains bullish on its 1D technical outlook (RSI = 62.492, MACD = 410.840, ADX = 32.007) as it maintains the medium term bullish trend inside its 1 month Channel Up. Since the index kept the 4H MA50 intact, it established it as its Support and is now halfway on the new bullish wave. The 2 prior rose by +4.30%, which gives a clear technical target (TP = 43,500)for the next HH.
## If you like our free content follow our profile to get more daily ideas. ##
## Comments and likes are greatly appreciated. ##
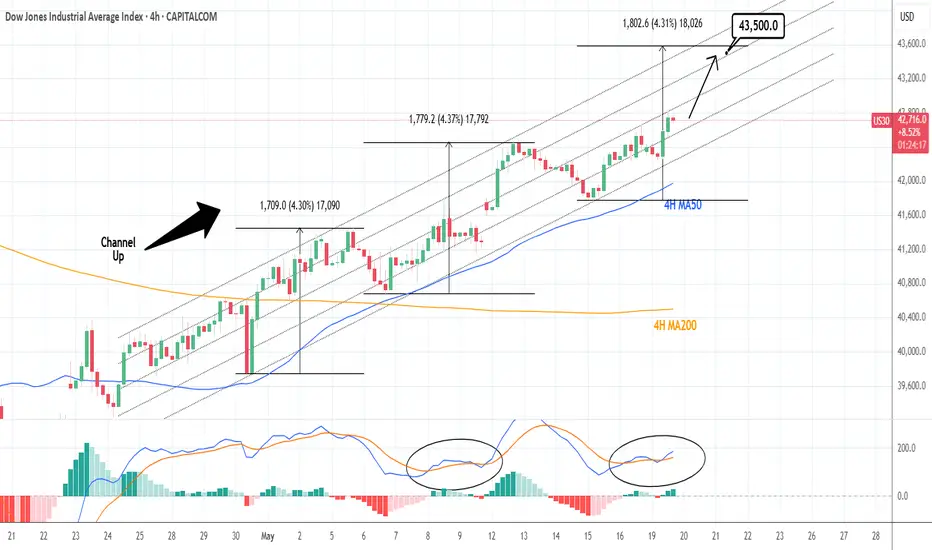
Chart spoke. We listened. See how price respected every level!"Great when BOS + supply/demand lines hit perfectly.
Most traders chased the bounce.
We waited in the shadows — right at the selling zone.
Wave 4? Textbook correction.
Wave 5? That’s where the money’s made.
Elliott Wave isn’t just theory — it’s a weapon.
Break of structure? Marked.
Zone tested? Clean.
Rejection? Savage.
This is how professionals trade — not with hope, but with precision.
DXY: playing checkers while we play chess.”**

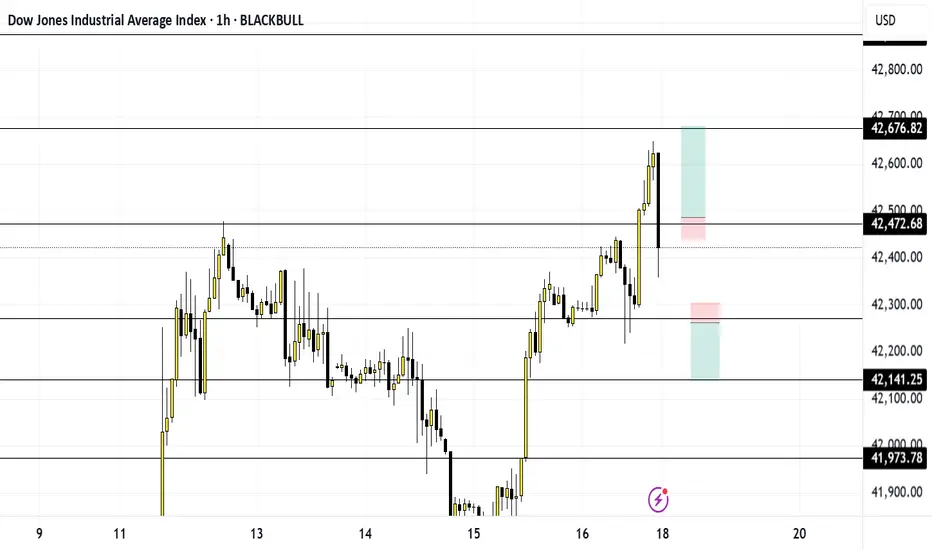
US30 Markup May 18thWhat did the tomato say to the other tomato during a race? Ketchup!! Now lets ketchup on these charts.
Price is in an uptrend and is nearing my key level 42,474. If price breaks and retests that area, then I will get in for the buy and buy up to 42,672 area.
However, like a puppy, price does whatever it wants. So, if price breaks structure around 42,268, I shall wait for price to break and retest that area so I can get in for the sell down to 42,141.
I shall be waiting for the break and retest on the one-minute timeframe for both the buy or sell.
Lastly, enjoy yourself, and be responsible.