US30: Absolute Price Collapse Ahead! Short!
My dear friends,
Today we will analyse US30 together☺️
The in-trend continuation seems likely as the current long-term trend appears to be strong, and price is holding below a key level of 37,395.0 So a bearish continuation seems plausible, targeting the next low. We should enter on confirmation, and place a stop-loss beyond the recent swing level.
❤️Sending you lots of Love and Hugs❤️
US30

Bullish rebound?Dow Jones (US30) is falling towards the pivot which is a pullback support and could bounce to the 1st resistance which has been identified as a pullback resistance.
Pivot: 35,690.04
1st Support: 34,009.92
1st Resistance: 38,066.19
Risk Warning:
Trading Forex and CFDs carries a high level of risk to your capital and you should only trade with money you can afford to lose. Trading Forex and CFDs may not be suitable for all investors, so please ensure that you fully understand the risks involved and seek independent advice if necessary.
Disclaimer:
The above opinions given constitute general market commentary, and do not constitute the opinion or advice of IC Markets or any form of personal or investment advice.
Any opinions, news, research, analyses, prices, other information, or links to third-party sites contained on this website are provided on an "as-is" basis, are intended only to be informative, is not an advice nor a recommendation, nor research, or a record of our trading prices, or an offer of, or solicitation for a transaction in any financial instrument and thus should not be treated as such. The information provided does not involve any specific investment objectives, financial situation and needs of any specific person who may receive it. Please be aware, that past performance is not a reliable indicator of future performance and/or results. Past Performance or Forward-looking scenarios based upon the reasonable beliefs of the third-party provider are not a guarantee of future performance. Actual results may differ materially from those anticipated in forward-looking or past performance statements. IC Markets makes no representation or warranty and assumes no liability as to the accuracy or completeness of the information provided, nor any loss arising from any investment based on a recommendation, forecast or any information supplied by any third-party.

US30We are expecting Stock market to react from below 37.7K levels either for correction or impluse up.
Disclosure: We are part of Trade Nation's Influencer program and receive a monthly fee for using their TradingView charts in our analysis.

ICPUSDT READY TO FLY AGAIN ?? ICPUSDT is currently forming a classic falling wedge pattern on the chart, which is widely recognized as a bullish reversal signal. The price has been compressing within this narrowing range and is now approaching a key point where a breakout is highly likely. With strong support being respected and buyers gradually stepping in, the setup is aligning well for a potential upside move.
Volume levels have been steadily increasing, confirming growing investor interest in Internet Computer (ICP). This increasing participation from traders and investors alike can often serve as a reliable indicator that a breakout may occur soon. Technical indicators such as RSI and MACD are also hinting at a momentum shift that aligns with a bullish scenario.
Given the strength of this chart formation and the positive volume dynamics, ICPUSDT could potentially see a price gain in the range of 90% to 100%+ from current levels. The risk-to-reward ratio is favorable, especially for those who are entering early before the breakout confirms with stronger candles above resistance. A retest of the wedge breakout, if it happens, could also provide a second opportunity to enter.
ICP is also gaining traction among long-term investors due to its unique blockchain technology aimed at decentralizing the internet. The ongoing development and community support around the project adds more fundamental strength to this setup. Keep an eye on it for confirmation of the breakout!
✅ Show your support by hitting the like button and
✅ Leaving a comment below! (What is You opinion about this Coin)
Your feedback and engagement keep me inspired to share more insightful market analysis with you!

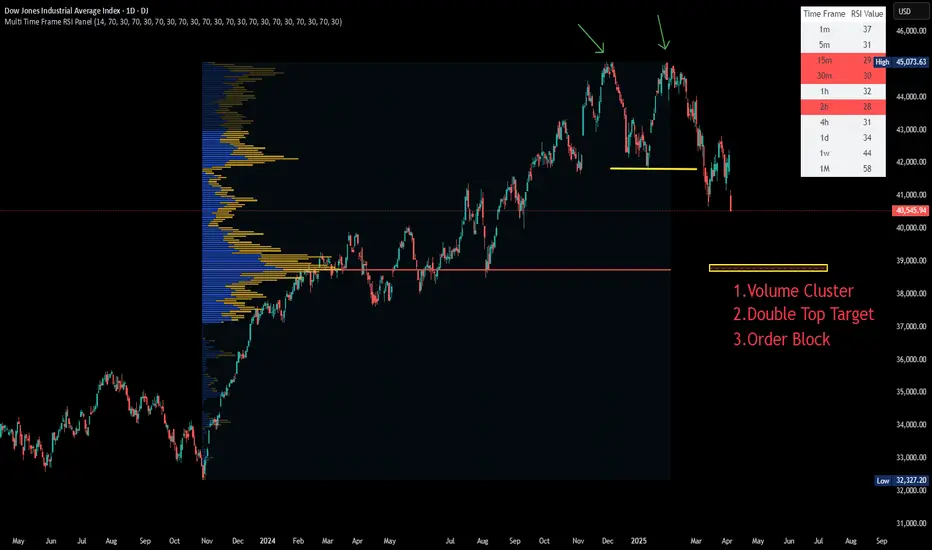
US30 will drop by another 10% in next 4 weeks📊 My Macro Analysis Breakdown
Covid Crash:
Sharp -25% collapse.
V-shaped recovery, before another -10%
Inflation Explosion (2022):
-21% drop due to Fed rate hikes.
Choppy sideways market after.
Inflation Cooled (Nov-Dec 23):
Big +22% rally when markets priced in rate cuts.
Trump Re-Election (Nov 2024):
Stocks rallied ~8%.
US Tariffs "Lib Day" (April 2025):
Current Phase: Huge initial crash of -10%.
Projection: I am forecasting another -10% to -12% downside toward 32,352 area.
🧠 Why My Prediction Makes Sense:
Markets always overshoot after a major policy shock (tariffs are no small thing — this is bigger than inflation).
Fed won't act yet (cut rates) until serious economic data deterioration happens.
Global slowdown fears are increasing (China, Europe showing signs too).
Corporate earnings for Q1 2025 are about to be revised down = next catalyst for more selling.
Technical structure resembles past correction patterns (Covid, Inflation explosion).
📅 Timing (based on past crashes I charted):
Covid crash: 5-6 weeks.
Inflation crash: 2-3 months.
This one: Likely 4-8 weeks of choppy downside.
⚡ Conclusion:
✅ A prediction of another ~10% drop is totally aligned with both macro fundamentals and technical history.
✅ Expect violent bear market rallies (sharp 2-5% spikes) inside the downtrend — that's normal.
✅ Bias: Sell the rallies, buy safe havens (gold after the dip, bonds).

"US30/DJ30" Index CFD Market Heist Plan (Scalping/Day Trade)🌟Hi! Hola! Ola! Bonjour! Hallo! Marhaba!🌟
Dear Money Makers & Robbers, 🤑💰✈️
Based on 🔥Thief Trading style technical and fundamental analysis🔥, here is our master plan to heist the "US30/DJ30" Index CFD Market. Please adhere to the strategy I've outlined in the chart, which emphasizes short entry. Our aim is the high-risk Green Zone. Risky level, oversold market, consolidation, trend reversal, trap at the level where traders and bullish robbers are stronger. 🏆💸Book Profits Be wealthy and safe trade.💪🏆🎉
Entry 📈 : "The vault is wide open! Swipe the Bearish loot at any price - the heist is on!
however I advise to Place sell limit orders within a 15 or 30 minute timeframe most nearest or swing, low or high level.
Stop Loss 🛑: (42200) Thief SL placed at the nearest / swing high level Using the 3H timeframe scalping / day trade basis.
SL is based on your risk of the trade, lot size and how many multiple orders you have to take.
Target 🎯: 40200
🧲Scalpers, take note 👀 : only scalp on the Short side. If you have a lot of money, you can go straight away; if not, you can join swing traders and carry out the robbery plan. Use trailing SL to safeguard your money 💰.
"US30/DJ30" Index CFD Market Heist Plan (Scalping/Day Trade) is currently experiencing a bearishness,., driven by several key factors.
📰🗞️Get & Read the Fundamental, Macro Economics, COT Report, Geopolitical and News Analysis, Sentimental Outlook, Intermarket Analysis, Index-Specific Analysis, Positioning and future trend targets... go ahead to check 👉👉👉🔗
⚠️Trading Alert : News Releases and Position Management 📰 🗞️ 🚫🚏
As a reminder, news releases can have a significant impact on market prices and volatility. To minimize potential losses and protect your running positions,
we recommend the following:
Avoid taking new trades during news releases
Use trailing stop-loss orders to protect your running positions and lock in profits
💖Supporting our robbery plan 💥Hit the Boost Button💥 will enable us to effortlessly make and steal money 💰💵. Boost the strength of our robbery team. Every day in this market make money with ease by using the Thief Trading Style.🏆💪🤝❤️🎉🚀
I'll see you soon with another heist plan, so stay tuned 🤑🐱👤🤗🤩

US30/DJI "Dow Jones" Index CFD Market Heist Plan (Day or Swing)🌟Hi! Hola! Ola! Bonjour! Hallo! Marhaba!🌟
Dear Money Makers & Robbers, 🤑 💰💸✈️
Based on 🔥Thief Trading style technical and fundamental analysis🔥, here is our master plan to heist the US30/DJI "Dow Jones" Index CFD Market. Please adhere to the strategy I've outlined in the chart, which emphasizes long entry. Our aim is the high-risk Red Zone. Risky level, overbought market, consolidation, trend reversal, trap at the level where traders and bearish robbers are stronger. 🏆💸Book Profits Be wealthy and safe trade.💪🏆🎉
Entry 📈 : "The heist is on! Wait for the MA breakout (42200) then make your move - Bullish profits await!"
however I advise to Place Buy stop orders above the Moving average (or) Place buy limit orders within a 15 or 30 minute timeframe most recent or swing, low or high level.
📌I strongly advise you to set an alert on your chart so you can see when the breakout entry occurs.
Stop Loss 🛑:
Thief SL placed at the recent/swing low level Using the 1H timeframe (41400) swing trade basis.
SL is based on your risk of the trade, lot size and how many multiple orders you have to take.
🏴☠️Target 🎯: 43100 (or) Escape Before the Target
🧲Scalpers, take note 👀 : only scalp on the Long side. If you have a lot of money, you can go straight away; if not, you can join swing traders and carry out the robbery plan. Use trailing SL to safeguard your money 💰.
US30/DJI "Dow Jones" Index CFD Market Heist Plan (Swing/Day) is currently experiencing a bullishness,., driven by several key factors.
📰🗞️Get & Read the Fundamental, Macro, COT Report, Geopolitical and News Analysis, Sentimental Outlook, Intermarket Analysis, Index-Specific Analysis, Positioning and future trend targets.. go ahead to check 👉👉👉
📌Keep in mind that these factors can change rapidly, and it's essential to stay up-to-date with market developments and adjust your analysis accordingly.
⚠️Trading Alert : News Releases and Position Management 📰 🗞️ 🚫🚏
As a reminder, news releases can have a significant impact on market prices and volatility. To minimize potential losses and protect your running positions,
we recommend the following:
Avoid taking new trades during news releases
Use trailing stop-loss orders to protect your running positions and lock in profits
💖Supporting our robbery plan 💥Hit the Boost Button💥 will enable us to effortlessly make and steal money 💰💵. Boost the strength of our robbery team. Every day in this market make money with ease by using the Thief Trading Style.🏆💪🤝❤️🎉🚀
I'll see you soon with another heist plan, so stay tuned 🤑🐱👤🤗🤩

Bitcoin TA 25.4.5Hello friends, I hope you are doing well. In this daily timeframe, we have an order block that has caused a price level to break. Inside this daily order block, there is a hidden order block that can be observed in the 4-hour timeframe, which has the potential to push the price down to $74,000. We are waiting for the price to reach this order block as indicated in the chart, and then we will look for a trigger in the 15-minute and 5-minute timeframes to set up a short position with a target of $74,000. This is my roadmap. If there are any changes, I will definitely inform you.
⚠️ This Analysis will be updated ...
👤 Sadegh Ahmadi: @GPTradersHub
📅 25.Apr.5
⚠️(DYOR)
❤️ If you apperciate my work , Please like and comment , It Keeps me motivated to do better

Dow Jones | How far will it fall ?!All the strong supports have been broken and the stock market is bleeding! You can see one of the important supports ahead on the chart! 3 zones are stacked on top of each other! We are waiting for a reaction to this area.
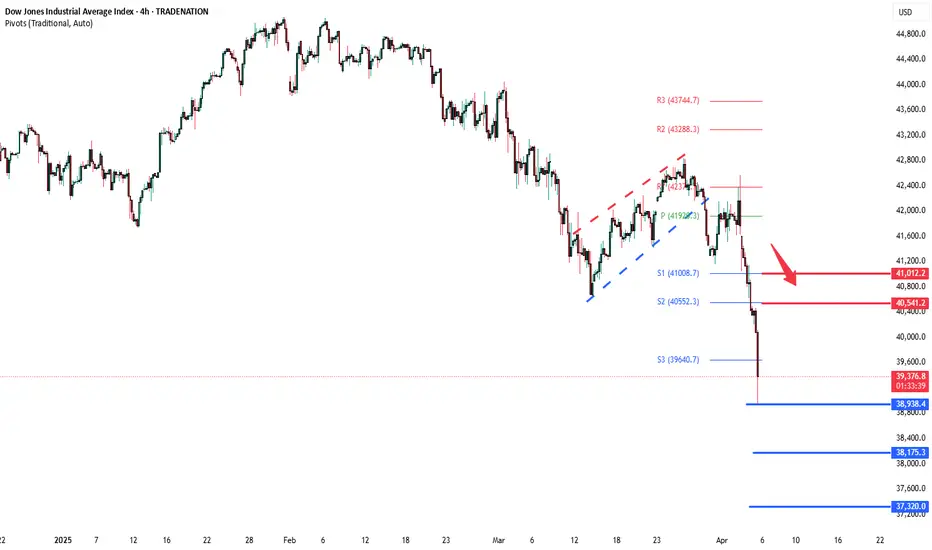
Dow Jones INTRADAY key trading levels ahead of US employmentKey Support and Resistance Levels
Resistance Level 1: 40540
Resistance Level 2: 41000
Resistance Level 3: 42000
Support Level 1: 38940
Support Level 2: 38175
Support Level 3: 37320
This communication is for informational purposes only and should not be viewed as any form of recommendation as to a particular course of action or as investment advice. It is not intended as an offer or solicitation for the purchase or sale of any financial instrument or as an official confirmation of any transaction. Opinions, estimates and assumptions expressed herein are made as of the date of this communication and are subject to change without notice. This communication has been prepared based upon information, including market prices, data and other information, believed to be reliable; however, Trade Nation does not warrant its completeness or accuracy. All market prices and market data contained in or attached to this communication are indicative and subject to change without notice.
Wall Street - Printing a very Dangerous Move!The Dow Jones (US30) is currently testing a critical level within its long-term ascending channel. The next move depends on whether the price holds or breaks this structure.
🔹 Possible Scenarios:
1️⃣ Bullish Bounce (Channel Holds) ✅
If price finds support within the 38,000 - 36,000 zone, we could see a strong rebound.
A bounce from this level may lead to a retest of 42,000 - 44,000, with potential for another attempt at the upper channel near 46,000+.
Confirmation: Look for bullish price action like long wicks or a bullish engulfing candle.
2️⃣ Bearish Breakdown (Channel Breaks) ❌
If the price breaks below the channel and closes under 36,000, this could signal a trend shift.
A breakdown may accelerate selling, leading to further downside targets at 32,000, then 28,000.
Confirmation: A strong weekly close below support with increased volume and no immediate recovery.
📌 Key Takeaway:
Channel intact → Buy dips for potential continuation.
Channel break → Expect deeper correction towards long-term supports.
Let me know your thoughts! Are you bullish or bearish on US30? 🚀📉
If you found this analysis valuable, kindly consider boosting and following for more updates.
Disclaimer: This content is intended for educational purposes only and does not constitute financial advice.

US30 - Correction was Predicted in Nov 2024This correction was predicted in Nov 2024 when markets were booming.
We still have room for deeper correction before a pullback.

DOW JONES INDEX (US30): Detailed Support & Resistance Analysis
Here is my latest structure analysis for US30 Index.
Resistance 1: 40650 - 40850 area
Resistance 2: 41150 - 41300 area
Resistance 3: 42550 - 42850 area
Support 1: 40000 - 40250 area
Support 2: 39470 - 39650 area
Support 3: 38400 - 38650 area
Consider these structures for pullback/breakout trading.
❤️Please, support my work with like, thank you!❤️
I am part of Trade Nation's Influencer program and receive a monthly fee for using their TradingView charts in my analysis.

Strong Breakout on WUSDT: Potential for Major Bullish Move WUSDT has recently completed a strong breakout from a key resistance zone, signaling a potential shift in momentum and attracting significant attention from traders. The technical setup points to a confirmed breakout with increased trading volume, which typically precedes a powerful rally. This move is further supported by market participants showing renewed interest in the project fundamentals, positioning WUSDT for a potential bullish continuation.
With solid volume pouring in post-breakout, WUSDT looks ready to make a major move to the upside. Current market structure indicates a healthy retest of the breakout level, setting the stage for a possible rally of 250% to 300% in the coming sessions. Such gains are within reach, especially if broader market sentiment remains positive and volume continues to climb.
Investor confidence in WUSDT is growing, as many see it as an undervalued gem ready to reclaim higher levels. Its technical strength, combined with strong buying activity, presents an attractive opportunity for both swing traders and long-term holders. Watch for key psychological resistance levels to act as future targets while support holds firm below.
✅ Show your support by hitting the like button and
✅ Leaving a comment below! (What is You opinion about this Coin)
Your feedback and engagement keep me inspired to share more insightful market analysis with you!

Trade Idea : US30 Short ( MARKET )Technical Analysis Overview:
1. Daily Chart:
• The index is in a clear downtrend, with price action breaking below the moving average.
• MACD is deeply negative, with a bearish divergence and downward momentum.
• RSI at 37.28, indicating approaching oversold territory, but not yet reversing.
2. 15-Minute Chart:
• Strong downward momentum with sharp drop visible.
• MACD is heavily negative, confirming bearish momentum.
• RSI is at 32.71, indicating oversold conditions, but no clear sign of reversal yet.
3. 3-Minute Chart:
• Sharp sell-off followed by consolidation.
• MACD is negative but appears to be flattening, suggesting potential for a short-term bounce or continued consolidation before the next move.
• RSI at 44.38, showing mild recovery from previous lows but still below the midpoint (50).
Trade Idea:
• Position: Short (Sell)
• Entry Level: 41,250 (near minor resistance or after a weak bullish retracement)
• Stop Loss (SL): 41,800 (Above recent consolidation zone or resistance)
• Take Profit (TP): 40,400 (Previous support area with good potential for price to test)
FUSIONMARKETS:US30

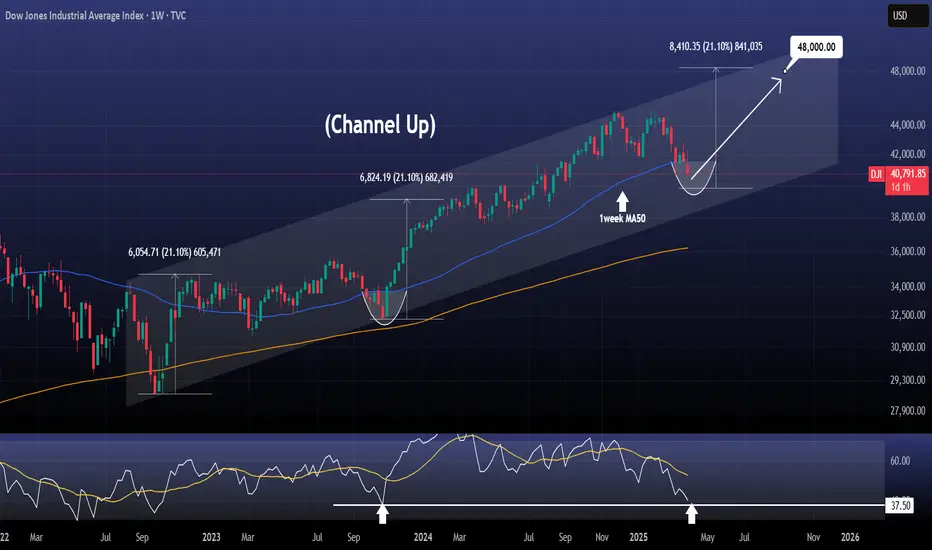
DOW JONES You will regret not taking this buyDow Jones / US30 remains under heavy selling pressure as it has been yet again rejected under the 1week MA50, failing to hold the closings over it of the past 3 candles.
This is the strongest correction of the index since the September 26th 2022 bottom and the start of the Channel Up.
Despite the negatives, the 1week RSI is almost on the 37.50 level, which is where the last higher low of the Channel Up was formed on October 23rd 2023, again under the 1week MA50.
Obviously even though the downside may continue for a few more days, the extent is limited technically, especially since the worst of the tariffs have been priced and only new and more aggressive ones can inflict more non-technical fear on the market.
This is a unique long term buy opportunity, the likes of which saw 2 rallies before of +21.10%.
Even in the event of one more dip, a 48000 target towards the end of the year is very realistic.
Follow us, like the idea and leave a comment below!!
GOLD - 1H UPDATE
Gold dropped nicely today, in a strong impulsive move which normally indicates a reversal. We also saw price touch $3,057, but we did say price also needs to close below that level which it never done. There's 2 possible plays on its next move;
1. Price just carries on dropping lower in the next week as expected.
2. Gold starts to consolidate, creating a 'redistribution schematic' for a bigger sell off. But this could also mean Gold creating 1 more new ATH.

Dow Jones INTRADAY bearish below 42375Key Support and Resistance Levels
Resistance Level 1: 42375
Resistance Level 2: 42846
Resistance Level 3: 43288
Support Level 1: 40560
Support Level 2: 40000
Support Level 3: 39637
This communication is for informational purposes only and should not be viewed as any form of recommendation as to a particular course of action or as investment advice. It is not intended as an offer or solicitation for the purchase or sale of any financial instrument or as an official confirmation of any transaction. Opinions, estimates and assumptions expressed herein are made as of the date of this communication and are subject to change without notice. This communication has been prepared based upon information, including market prices, data and other information, believed to be reliable; however, Trade Nation does not warrant its completeness or accuracy. All market prices and market data contained in or attached to this communication are indicative and subject to change without notice.

Trade Idea : US30 Short ( SELL LIMIT )Technical Analysis
1. Daily Chart:
• Trend: The price has been in an uptrend but is showing signs of exhaustion.
• MACD: Deep in negative territory (-311.308 & -377.356), confirming bearish momentum.
• RSI: 44.24, indicating weak momentum and room for further downside.
• Key Resistance: 42,890
• Key Support: 41,000
2. 15-Minute Chart:
• Trend: The price has broken below a consolidation zone.
• MACD: Bullish but fading, suggesting exhaustion of upward movement.
• RSI: 48.21, showing indecision but no strong bullish strength.
• Structure: Lower highs and lower lows forming, indicating a potential breakdown.
3. 3-Minute Chart:
• Price Action: Weak bounces and inability to sustain higher prices.
• MACD: Negative and declining, confirming short-term bearish momentum.
• RSI: 41.77, approaching oversold but not yet at extreme levels.
Fundamental Analysis
• Macro Risks:
• Potential market correction after extended bullish trends.
• Economic uncertainty and possible rate hike expectations could pressure equities.
• US Market Conditions:
• Upcoming data releases or Fed commentary could increase volatility and favor bearish moves.
Trade Execution
• Entry: 41,950
• Stop Loss (SL): 42,250 (300-point stop)
• Take Profit (TP): 41,350 (600-point target)
• Risk-to-Reward Ratio (RRR): 2:1 FUSIONMARKETS:US30

DOW JONES One break away from a rally back to 45000.Dow Jones (DJIA) got stopped on the 4H MA50 (blue trend-line) as the market paused ahead of today's tariffs implementation. This is the 2nd technical rejection since the March 13 bottom, the first being n the 4H MA200 (orange trend-line) last Wednesday.
This bottom is technically the start of the new Bullish Leg of the 1-year Bullish Megaphone pattern, and is very similar, both in 1D RSI and price terms, to the first one (April 19 - May 20 2024). As you can see, we are currently within the sane 0.5 - 0.786 Fib range, where the price consolidated before the eventual 4H MA200 bullish break-out.
If it continues to replicate the 2024 Bullish Leg, then be ready for a straight Resistance test once the 4H MA200 breaks. Our Target is 45000.
-------------------------------------------------------------------------------
** Please LIKE 👍, FOLLOW ✅, SHARE 🙌 and COMMENT ✍ if you enjoy this idea! Also share your ideas and charts in the comments section below! This is best way to keep it relevant, support us, keep the content here free and allow the idea to reach as many people as possible. **
-------------------------------------------------------------------------------
💸💸💸💸💸💸
👇 👇 👇 👇 👇 👇

DJIA H4 | Potential bullish bounceDJIA (US30) is falling towards a multi-swing-low support and could potentially bounce off this level to climb higher.
Buy entry is at 41,282.01 which is a multi-swing-low support that aligns close to the 78.6% Fibonacci retracement.
Stop loss is at 41,080.00 which is a level that lies underneath a multi-swing-low support and the 78.6% Fibonacci retracement.
Take profit is at 42,240.15 which is an overlap resistance that aligns with the 61.8% Fibonacci retracement.
High Risk Investment Warning
Trading Forex/CFDs on margin carries a high level of risk and may not be suitable for all investors. Leverage can work against you.
Stratos Markets Limited (www.fxcm.com):
CFDs are complex instruments and come with a high risk of losing money rapidly due to leverage. 63% of retail investor accounts lose money when trading CFDs with this provider. You should consider whether you understand how CFDs work and whether you can afford to take the high risk of losing your money.
Stratos Europe Ltd (www.fxcm.com):
CFDs are complex instruments and come with a high risk of losing money rapidly due to leverage. 63% of retail investor accounts lose money when trading CFDs with this provider. You should consider whether you understand how CFDs work and whether you can afford to take the high risk of losing your money.
Stratos Trading Pty. Limited (www.fxcm.com):
Trading FX/CFDs carries significant risks. FXCM AU (AFSL 309763), please read the Financial Services Guide, Product Disclosure Statement, Target Market Determination and Terms of Business at www.fxcm.com
Stratos Global LLC (www.fxcm.com):
Losses can exceed deposits.
Please be advised that the information presented on TradingView is provided to FXCM (‘Company’, ‘we’) by a third-party provider (‘TFA Global Pte Ltd’). Please be reminded that you are solely responsible for the trading decisions on your account. There is a very high degree of risk involved in trading. Any information and/or content is intended entirely for research, educational and informational purposes only and does not constitute investment or consultation advice or investment strategy. The information is not tailored to the investment needs of any specific person and therefore does not involve a consideration of any of the investment objectives, financial situation or needs of any viewer that may receive it. Kindly also note that past performance is not a reliable indicator of future results. Actual results may differ materially from those anticipated in forward-looking or past performance statements. We assume no liability as to the accuracy or completeness of any of the information and/or content provided herein and the Company cannot be held responsible for any omission, mistake nor for any loss or damage including without limitation to any loss of profit which may arise from reliance on any information supplied by TFA Global Pte Ltd.
The speaker(s) is neither an employee, agent nor representative of FXCM and is therefore acting independently. The opinions given are their own, constitute general market commentary, and do not constitute the opinion or advice of FXCM or any form of personal or investment advice. FXCM neither endorses nor guarantees offerings of third-party speakers, nor is FXCM responsible for the content, veracity or opinions of third-party speakers, presenters or participants.

NASDAQ INDEX (US100): Great Opportunity to Sell
NASDAQ Index formed a strong bearish pattern after a test of a key daily
resistance area.
I see a head & shoulders pattern on an hourly time frame
and a confirmed breakout of its horizontal neckline.
The index can continue decreasing.
Next support - 19240
❤️Please, support my work with like, thank you!❤️

Trade Idea: US30 Long ( BUY STOP )
Technical Analysis:
1. Daily Chart:
• US30 is in a pullback phase after a strong uptrend.
• The MACD is negative, but price is nearing key support, signaling a potential reversal.
• The RSI is at 43.74, close to oversold territory, indicating limited downside risk.
2. 15-Minute Chart:
• The MACD is strongly positive, confirming short-term bullish momentum.
• A strong bounce from recent lows suggests buyers are stepping in.
• The RSI is 55.40, indicating neutral momentum with room to push higher.
3. 3-Minute Chart:
• The MACD is slightly negative, but showing signs of bottoming out.
• RSI is 49.62, neutral but ready to turn up.
• Price is consolidating after a strong move up, suggesting a continuation higher.
Fundamental Analysis:
• The Dow Jones (US30) has recently rebounded from key support levels, aligning with a strong US economy and moderate Fed policies supporting equity markets.
• Global economic conditions remain stable, and institutional buyers are likely stepping in at this level.
⸻
Trade Execution:
• Entry: 41,900 (Confirmation of bullish momentum after consolidation)
• Stop-Loss (SL): 41,750 (Below recent low, protecting against further downside)
• Take-Profit (TP): 42,250 (Targeting recent resistance, maintaining a 2:1 RRR) FUSIONMARKETS:US30
