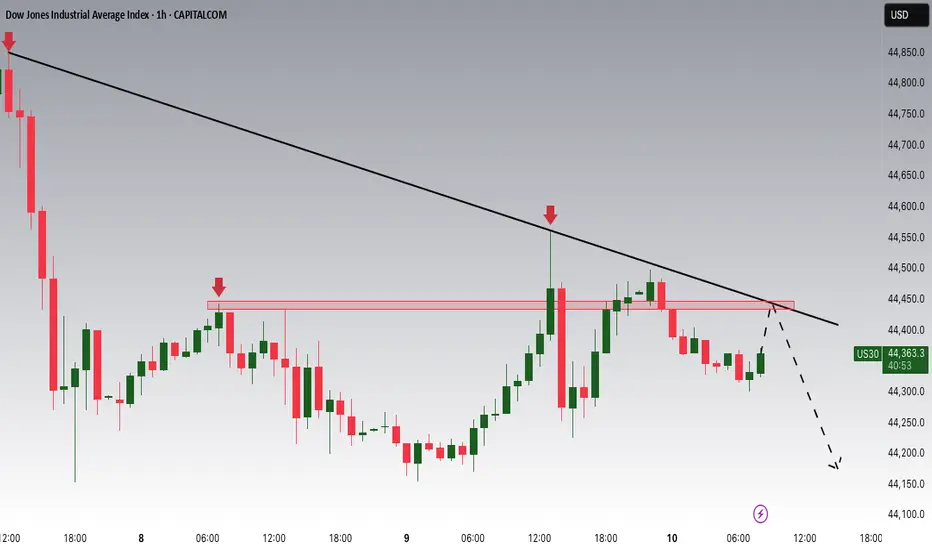
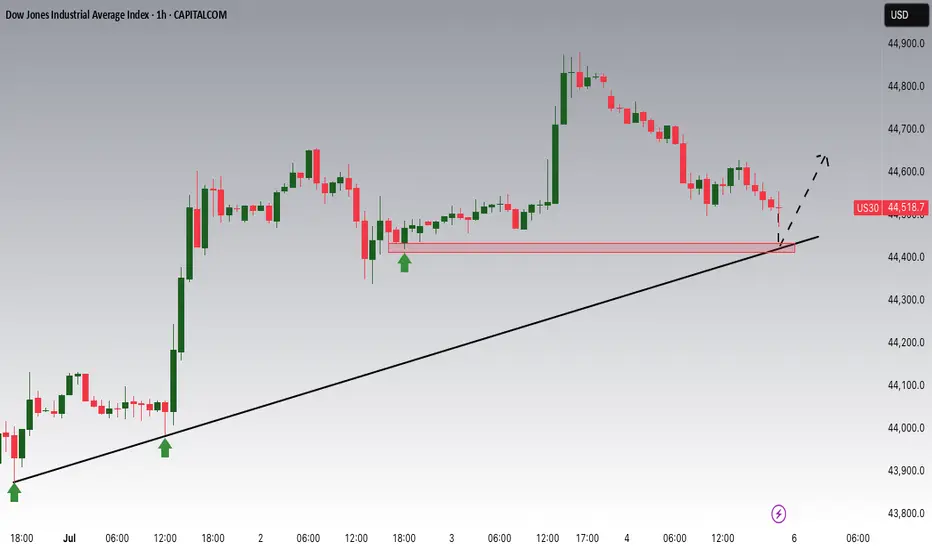
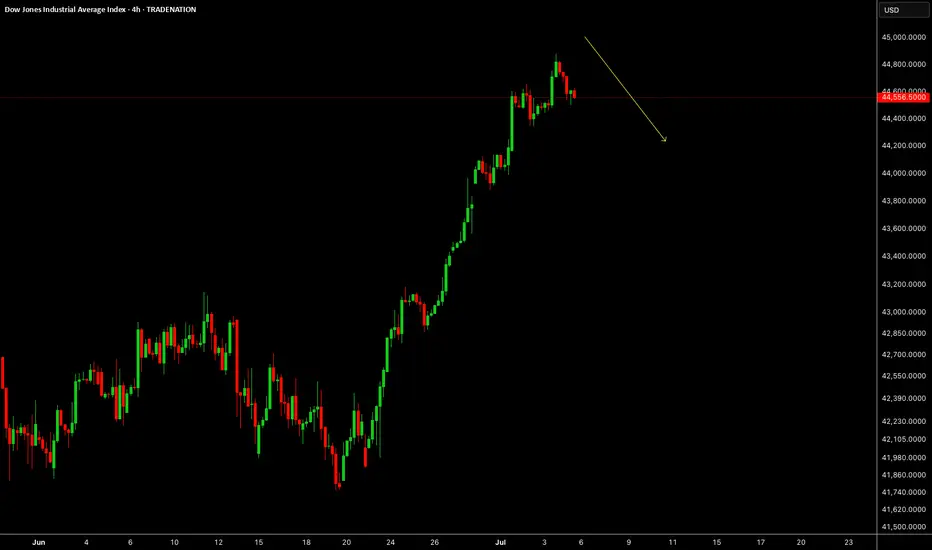
Dow Jones Potential DownsidesHey Traders, in today's trading session we are monitoring US30 for a selling opportunity around 44,450 zone. Dow Jones is trading in a downtrend and currently is in a correction phase in which it is approaching the trend at 44,450 support and resistance area.
Trade safe, Joe.
US30
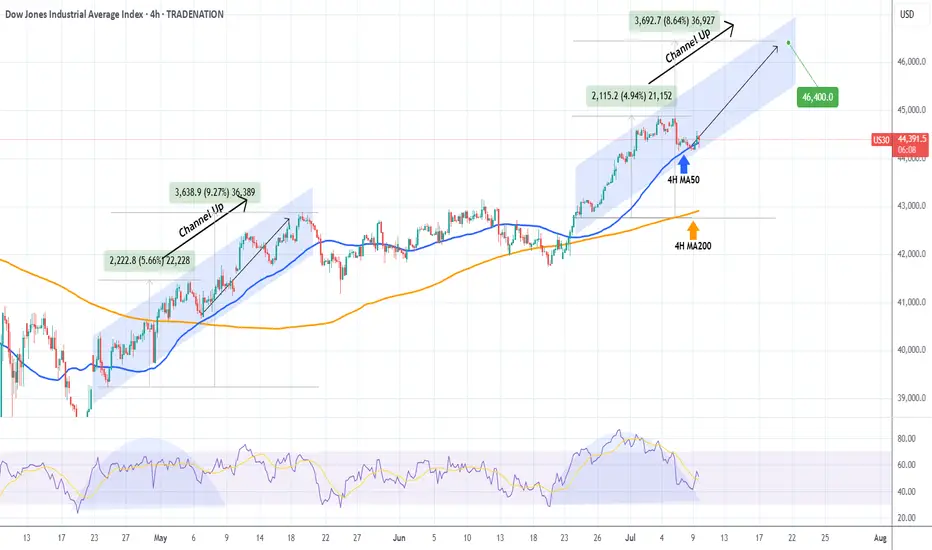
DOW JONES repeating May's pattern.Dow Jones (DJI) has been testing its 4H MA50 (blue trend-line) since yesterday, following 2 straight weeks of trading strongly above it.
If it holds and rebounds, the pattern will draw even more similarities with May's Channel Up, which after the May 06 Low, it resumed the uptrend to peak on a +9.27% rise from the bottom, before breaking below the 4H MA50.
Since the current rise is -0.70% weaker (+4.94% against +5.66%) from May's fractal, we can assume that as long as the 4H MA50 holds, we can expect a peak at 46400.
-------------------------------------------------------------------------------
** Please LIKE 👍, FOLLOW ✅, SHARE 🙌 and COMMENT ✍ if you enjoy this idea! Also share your ideas and charts in the comments section below! This is best way to keep it relevant, support us, keep the content here free and allow the idea to reach as many people as possible. **
-------------------------------------------------------------------------------
Disclosure: I am part of Trade Nation's Influencer program and receive a monthly fee for using their TradingView charts in my analysis.
💸💸💸💸💸💸
👇 👇 👇 👇 👇 👇
GOLD - SHORT TO $2,800 (UPDATE)Gold has dropped even lower overnight during the Asian market session. We're now running 500 PIPS in profit & hopefully this is only the BEGINNING of this huge move.
Being extremely careful here, as Gold is currently at a make or break sort of area.

Us30 Long Day Trade New York OpenIm looking for a long on the Us30 for a 1:3 min , im trade a long after a the retest due to the the trend has been bullish

Dow Jones Below Key Pivot – Tariff Talks to Define Next MoveDow Jones – Overview
Fundamental Outlook:
In April, President Trump capped all so-called reciprocal tariffs at 10% until July 9, giving room for trade negotiations with key partners. That same month, the Nasdaq slipped into bear market territory, while the Dow and S&P 500 entered correction zones.
Since then, Wall Street has rebounded sharply. Last week, both the Nasdaq and S&P 500 surged to all-time highs, driven by a strong labor market that helped ease recession fears.
Technical Outlook:
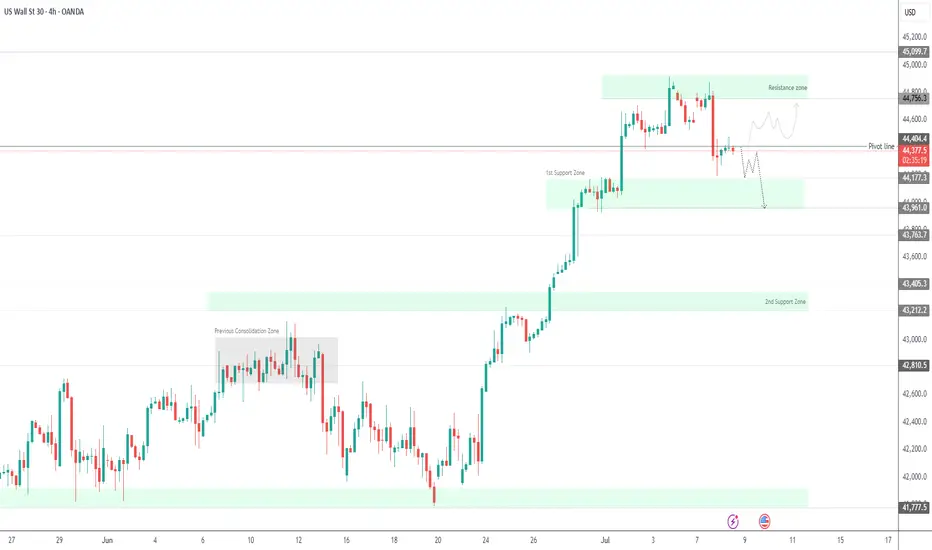
Currently, Dow Jones is trading below the pivot level at 44410, which signals ongoing bearish momentum.
A sustained move below 44410 supports further downside toward 44180, with a break below this level opening the path to 43960.
However, if price reverses and closes above 44410 on the 1H or 4H timeframe, it may trigger a bullish move targeting 44750 and beyond.
Support: 44180 / 43960 / 43770
Resistance: 44515 / 44750 / 45100
Note:
Progress in tariff negotiations would likely support further upside in U.S. indices.
Lack of resolution may keep the Dow under bearish pressure in the short term.
US30 short bias- 9th July 2025
I have conducted a comprehensive multi-timeframe analysis of the US30 index, with particular focus on its recent price action and structural context.
Quarterly Timeframe:
On the three-month timeframe, the second quarter’s candle close is notably bullish, having engulfed the previous ten quarterly candles. This significant engulfing pattern suggests strong underlying momentum. Importantly, there has not yet been a body closure above this quarterly candle, which indicates that price may attempt to break above its range to establish new all-time highs.
Recently, price action reached an all-time high near a major psychological level of 45,000 before retracing sharply to a liquidity region around 37,500. Since this retracement, there has been substantial accumulation of bullish orders, reinforcing the potential for price to retest and surpass prior highs.
Monthly Timeframe:
On the monthly timeframe, price has approached a key liquidity region around 44,500, where it is currently encountering resistance. While the higher timeframe bias remains firmly bullish, it is reasonable to expect healthy retracements before new all-time highs are made. It is worth noting that price has already broken above significant monthly levels at 41,750 and 42,600.
A retracement to these regions to collect further liquidity remains plausible, although this scenario is speculative rather than confirmed at present. Consequently, my bias on the monthly timeframe remains neutral in the short term, pending further developments.
Weekly Timeframe:
Price action on the weekly timeframe mirrors that of the monthly. There is little of note beyond the observation that price absorbed considerable bullish orders at 41,750 and has since encountered resistance near 44,750, leading to a modest retracement. Given this structure, I maintain a neutral outlook on the weekly timeframe.
Daily Timeframe:
On the daily chart, we can observe that the bullish momentum initiated from the 43,000 order block region faced resistance at approximately 44,500. Price briefly broke above this region on Thursday, 3rd July, but quickly closed below it on Monday, indicating a lack of sustained buying interest to propel price higher.
This retracement suggests that the market is searching for a deeper liquidity area to support its next upward move. Notably, a bearish three-pin formation is present, implying that price may break below the recent lows around 44,150. Accordingly, my bias for today is bearish.
4-Hour Timeframe:
In alignment with the daily bias, the 4-hour timeframe indicates that price is likely to target Monday’s low at approximately 44,155. The next key liquidity region lies around 44,000, where substantial bullish orders were previously filled. I am currently waiting for price to offer a suitable entry region to sell towards 44,000.
I am also mindful that the FOMC minutes are scheduled for release today, which could introduce significant volatility. Should a valid setup emerge, I will look to enter a short position. Specifically, if the current 4-hour candle closes bearish, I intend to consider shorts from around 44,220.
---
Disclaimer:
This analysis is for educational purposes only and does not constitute financial advice. Always conduct your own research and manage risk accordingly.

US30 Will Fall!
HI,Traders !
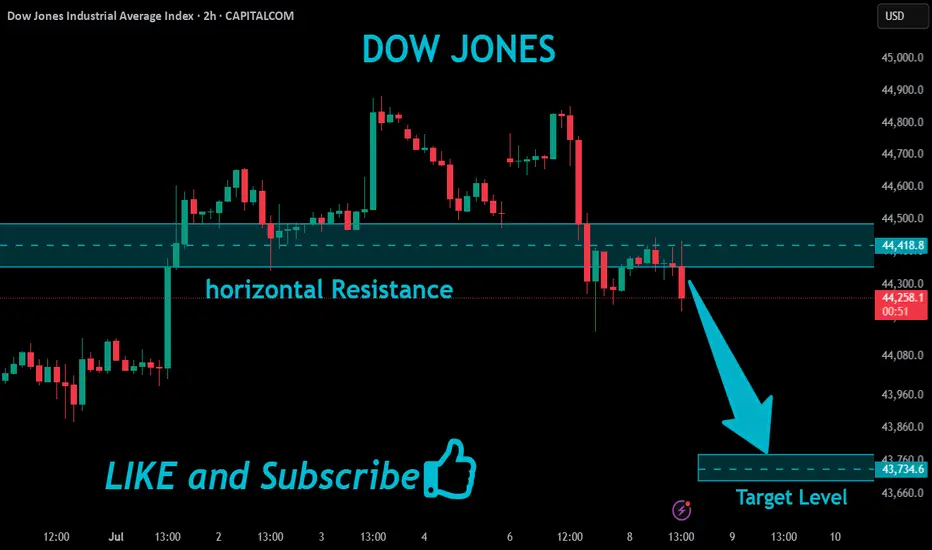
US30 made a retest
Of the key horizontal
Resistance level of 44418.8
From where we are
Already seeing a bearish
Reaction and we will
Be expecting a
Further bearish move down !
Comment and subscribe to help us grow !
GOLD - SHORT TO $2,800 (UPDATE)Gold once again last night came back to test our resistance zone, after huge bullish momentum all yesterday. But again we saw a bearish rejection from our ‘supply zone’, pushing price back down 300 PIPS.
Being extremely careful here, as Gold is currently at a make or break sort of area.

DowJones Bullish trend support at 44000Key Support and Resistance Levels
Resistance Level 1: 45000
Resistance Level 2: 45440
Resistance Level 3: 46000
Support Level 1: 44000
Support Level 2: 43700
Support Level 3: 43430
This communication is for informational purposes only and should not be viewed as any form of recommendation as to a particular course of action or as investment advice. It is not intended as an offer or solicitation for the purchase or sale of any financial instrument or as an official confirmation of any transaction. Opinions, estimates and assumptions expressed herein are made as of the date of this communication and are subject to change without notice. This communication has been prepared based upon information, including market prices, data and other information, believed to be reliable; however, Trade Nation does not warrant its completeness or accuracy. All market prices and market data contained in or attached to this communication are indicative and subject to change without notice.

US30 Is Bearish! Sell!
Please, check our technical outlook for US30.
Time Frame: 12h
Current Trend: Bearish
Sentiment: Overbought (based on 7-period RSI)
Forecast: Bearish
The price is testing a key resistance 44,371.8.
Taking into consideration the current market trend & overbought RSI, chances will be high to see a bearish movement to the downside at least to 43,586.3 level.
P.S
Please, note that an oversold/overbought condition can last for a long time, and therefore being oversold/overbought doesn't mean a price rally will come soon, or at all.
Disclosure: I am part of Trade Nation's Influencer program and receive a monthly fee for using their TradingView charts in my analysis.
Like and subscribe and comment my ideas if you enjoy them!

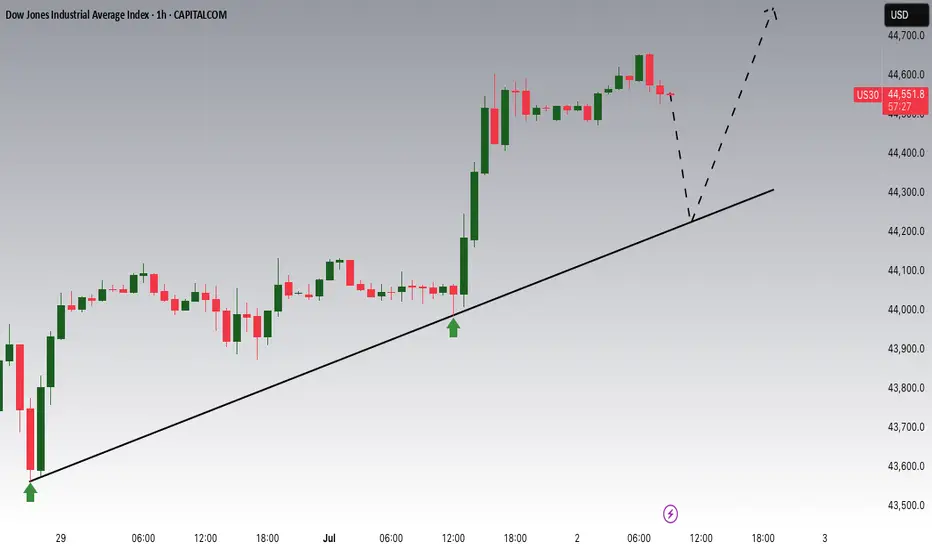
Dow Jones Potential UpsidesHey Traders, in tomorrow's trading session we are monitoring US30 for a buying opportunity around 44,400 zone, Dow Jones is trading in an uptrend and currently is in a correction phase in which it is approaching the trend 44,400 support and resistance area.
Trade safe, Joe.
Dow Jones H4 | Bullish uptrend to extend higher?The Dow Jones 30 (US30) could fall towards a swing-low support and could potentially bounce off this level to climb higher.
Buy entry is at 44,437.85 which is a swing-low support.
Stop loss is at 43,850.00 which is a level that lies underneath a swing-low support and the 23.6% Fibonacci retracement.
Take profit is at 45,046.46 which is a multi-swing-high resistance.
High Risk Investment Warning
Trading Forex/CFDs on margin carries a high level of risk and may not be suitable for all investors. Leverage can work against you.
Stratos Markets Limited (tradu.com ):
CFDs are complex instruments and come with a high risk of losing money rapidly due to leverage. 63% of retail investor accounts lose money when trading CFDs with this provider. You should consider whether you understand how CFDs work and whether you can afford to take the high risk of losing your money.
Stratos Europe Ltd (tradu.com ):
CFDs are complex instruments and come with a high risk of losing money rapidly due to leverage. 63% of retail investor accounts lose money when trading CFDs with this provider. You should consider whether you understand how CFDs work and whether you can afford to take the high risk of losing your money.
Stratos Global LLC (tradu.com ):
Losses can exceed deposits.
Please be advised that the information presented on TradingView is provided to Tradu (‘Company’, ‘we’) by a third-party provider (‘TFA Global Pte Ltd’). Please be reminded that you are solely responsible for the trading decisions on your account. There is a very high degree of risk involved in trading. Any information and/or content is intended entirely for research, educational and informational purposes only and does not constitute investment or consultation advice or investment strategy. The information is not tailored to the investment needs of any specific person and therefore does not involve a consideration of any of the investment objectives, financial situation or needs of any viewer that may receive it. Kindly also note that past performance is not a reliable indicator of future results. Actual results may differ materially from those anticipated in forward-looking or past performance statements. We assume no liability as to the accuracy or completeness of any of the information and/or content provided herein and the Company cannot be held responsible for any omission, mistake nor for any loss or damage including without limitation to any loss of profit which may arise from reliance on any information supplied by TFA Global Pte Ltd.
The speaker(s) is neither an employee, agent nor representative of Tradu and is therefore acting independently. The opinions given are their own, constitute general market commentary, and do not constitute the opinion or advice of Tradu or any form of personal or investment advice. Tradu neither endorses nor guarantees offerings of third-party speakers, nor is Tradu responsible for the content, veracity or opinions of third-party speakers, presenters or participants.

US30 LONG There's still bullish momentum on US30. Price has done third touch on US30, it printed a strong bullish signal for another bullish push, potentially to 45,000 psychological level.

US30US30 is due correction, it can start now or just above the ALH.
Disclosure: We are part of Trade Nation's Influencer program and receive a monthly fee for using their TradingView charts in our analysis.
US30 Will Move Higher! Buy!
Take a look at our analysis for US30.
Time Frame: 1h
Current Trend: Bullish
Sentiment: Oversold (based on 7-period RSI)
Forecast: Bullish
The market is testing a major horizontal structure 44,556.0.
Taking into consideration the structure & trend analysis, I believe that the market will reach 44,867.4 level soon.
P.S
Please, note that an oversold/overbought condition can last for a long time, and therefore being oversold/overbought doesn't mean a price rally will come soon, or at all.
Disclosure: I am part of Trade Nation's Influencer program and receive a monthly fee for using their TradingView charts in my analysis.
Like and subscribe and comment my ideas if you enjoy them!

DOW Jones go upCMCMARKETS:US30
Reaching the price level of 45,082.74 is inevitable. From the current closing price, there is a high probability of continuation toward the ATH.
However, the price levels 44,440 and 44,344.95 are also acceptable zones from which the move toward 45,082.74 may begin.
At the start of the upcoming week, as soon as the market opens, we are likely to move toward the ATH from one of these three levels.

US30 Scalp Buy SetupIf upside liquidation taken first before the entry is achieved then don't take the entry, wait for the entry and set tp & relax.

GOLD - SHORT TO $2,800 (UPDATE)Gold closing the week below our 'premium resistance zone', running roughly 170 PIPS in profit. Hope you all are in sells & running in profit like my Gold Fund investors as this was called live for you.
Don't forget we could also have a possible liquidity zone sitting just above $3,400 like I told you all earlier this week. Just something to be careful of & stay prepared in advance.

US30: Will Go Up! Long!
My dear friends,
Today we will analyse US30 together☺️
The market is at an inflection zone and price has now reached an area around 44,585.50 where previous reversals or breakouts have occurred.And a price reaction that we are seeing on multiple timeframes here could signal the next move up so we can enter on confirmation, and target the next key level of 44,663.28.Stop-loss is recommended beyond the inflection zone.
❤️Sending you lots of Love and Hugs❤️

US30 SHORT FROM RESISTANCE|
✅DOW JONES is going up now
But a strong resistance level is ahead at 45,077
Thus I am expecting a pullback
And a move down towards the target of 44,500
SHORT🔥
✅Like and subscribe to never miss a new idea!✅
Disclosure: I am part of Trade Nation's Influencer program and receive a monthly fee for using their TradingView charts in my analysis.

US30 Potential UpsidesHey Traders, in today's trading session we are monitoring US30 for a buying opportunity around 44,230 zone, Dow Jones is trading in an uptrend and currently is in a correction phase in which it is approaching the trend at 44,230 support and resistance area.
Trade safe, Joe.
US30 Awaits NFP – Bullish Above 44,410, Volatility Expected US30 (Dow Jones) – NFP Volatility in Focus
Today’s session is expected to be volatile due to the upcoming NFP report. Based on current forecasts, the outlook remains broadly positive for U.S. indices, though intraday swings are likely.
Technical Outlook:
As long as the price holds above 44,410, the bullish momentum remains intact, with potential upside targets at 44,750 and 44,910
A pullback toward 44,410 remains possible before any continuation higher.
However, a confirmed 4H close below 44,400 would shift the short-term structure to bearish, opening the door toward the 1st support zone around 44,180.
Key Levels:
• Resistance: 44,750 / 44,910 / 45,090
• Support: 44,410 / 44,180 / 43,970
Stay cautious — volatility is expected to spike around the release of the jobs data.

Dow’s fighting hard for that breakoutDow Jones is moving within a bullish channel
with low selling pressure —
strong legs pushing toward the top.
I’m expecting another solid bullish leg.
BLACKBULL:US30
