DOW JONES: Will the 4H MA200 produce a rally?Dow is neutral on its 1D technical outlook (RSI = 51.949, MACD = 356.820, ADX = 20.639), trading between its 4H MA50 and MA200 in the past 2 days. The price just hit the 4H MA200 for the 2nd time again at the bottom of the Channel Up. As long as it holds, the pattern can initiate the new bullish wave. We exepct it to repeat the +3.74% rise of the one before, TP = 43,550.
See how our prior idea has worked out:
## If you like our free content follow our profile to get more daily ideas. ##
## Comments and likes are greatly appreciated. ##
US30

GOLD - WAVE 5 BULLISH TO $3,622 (UPDATE)Gold is currently going through a strong 'accumulation' phase for buyers, hence why we're seeing these choppy price actions, trying to liquidate buyers. It won't surprise me if we see dips lower, but overall we remain bullish as long as Gold is ABOVE THE WAVE 2 LOW. Breaking below this low, will invalidate bullish structure.
Wave 2 Invalidation Level - $3,245❌

DowJones resistance retest at 42880Key Support and Resistance Levels
Resistance Level 1: 42880
Resistance Level 2: 43540
Resistance Level 3: 42940
Support Level 1: 41800
Support Level 2: 41400
Support Level 3: 41100
This communication is for informational purposes only and should not be viewed as any form of recommendation as to a particular course of action or as investment advice. It is not intended as an offer or solicitation for the purchase or sale of any financial instrument or as an official confirmation of any transaction. Opinions, estimates and assumptions expressed herein are made as of the date of this communication and are subject to change without notice. This communication has been prepared based upon information, including market prices, data and other information, believed to be reliable; however, Trade Nation does not warrant its completeness or accuracy. All market prices and market data contained in or attached to this communication are indicative and subject to change without notice.

DOW30/US30 - TIME TO MAKE MILLIONSTeam, Time to LONG SMALL POSTION ON US30 now
ADD DOUBLE UP at 41950-41800 - kill them if they drop this price range
Target 1 at 42400-42440
TAKE 50-70% volume for profit once it hit 1st target
BRING STOP LOSS TO BE and the remaning for 2nd target.

Potential bearish drop?Dow Jones (US30) has rejected off the pivot, which acts as an overlap resistance and could drop to the pullback support.
Pivot: 42,584.80
1st Support: 41,458.80
1st Resistance: 43,086.08
Risk Warning:
Trading Forex and CFDs carries a high level of risk to your capital and you should only trade with money you can afford to lose. Trading Forex and CFDs may not be suitable for all investors, so please ensure that you fully understand the risks involved and seek independent advice if necessary.
Disclaimer:
The above opinions given constitute general market commentary, and do not constitute the opinion or advice of IC Markets or any form of personal or investment advice.
Any opinions, news, research, analyses, prices, other information, or links to third-party sites contained on this website are provided on an "as-is" basis, are intended only to be informative, is not an advice nor a recommendation, nor research, or a record of our trading prices, or an offer of, or solicitation for a transaction in any financial instrument and thus should not be treated as such. The information provided does not involve any specific investment objectives, financial situation and needs of any specific person who may receive it. Please be aware, that past performance is not a reliable indicator of future performance and/or results. Past Performance or Forward-looking scenarios based upon the reasonable beliefs of the third-party provider are not a guarantee of future performance. Actual results may differ materially from those anticipated in forward-looking or past performance statements. IC Markets makes no representation or warranty and assumes no liability as to the accuracy or completeness of the information provided, nor any loss arising from any investment based on a recommendation, forecast or any information supplied by any third-party.

Wall Street Eyes Volatility: Dow Jones Tests Reversal ZoneUS30 (Dow Jones Index) — Clashing Forces of Risk & Reality
Technical Outlook — 16 June, 2025 | 1H Chart
Current Market Condition:
The Dow Jones (US30) has staged a recovery from the recent dip, but price is stalling at the Previous Day High (~42,588), a key confluence zone with the broken rising trendline, 50 EMA, and overhead supply.
This hesitation comes amid heightened global risk aversion triggered by the intensifying Iran–Israel conflict, adding pressure to global indices as investors rotate into safer assets like treasuries and gold. Despite intraday rebounds, equity bulls are showing signs of fatigue at resistance zones.
Markets are also bracing for upcoming US economic data and Fed commentary, which may further amplify intraday volatility.
Key Technical Highlights:
Price rejected from the confluence of PDH (~42,588), horizontal supply zone, and old rising trendline (yellow).
Currently hovering just under the 50 EMA; failure to hold could initiate a rotation back toward PD Low.
Stochastic RSI nearing overbought — suggests possible local top if no momentum breakout follows.
EMA 200 and the Previous Day Low at ~42,053 remain critical intraday supports.
Overall structure forming potential lower high under bearish macro cloud.
Trade Plan:
🔼 Bullish Breakout (Intraday Long):
Trigger: Break and sustained hold above 42,600 with rising volume
Target: 42,900 → 43,100
Stop Loss: Below 42,450 (to avoid whipsaws)
🔻 Bearish Rejection (Intraday Short):
Trigger: Clean rejection from PDH + trendline with bearish engulfing
Target: 42,100 → 42,050 → 41,850
Stop Loss: Above 42,650
⚖️ Neutral / Range Trade:
Play the range between PDH (~42,588) and PDL (~42,053) until breakout.
Scalp based on price reaction at either boundary with tight stop loss.
🛡️ Risk Management Note:
Global uncertainty tied to war escalation and Fed policy expectations make this a headline-driven market. News risk can spike volatility and invalidate technical setups. Trade with reduced size and increased caution, especially around US market open and geopolitical news cycles.
📢 If you found this analysis valuable, kindly consider boosting and following for more updates.
⚠️ Disclaimer: This content is intended for educational purposes only and does not constitute financial advice.

US30 Long OpportunityUS30 had a break out to the upside from $42560 and we are not seeing a potentially retracement to the break and retest level where we can expect a further jump to the upside. Seeing bullish structure on the 15 min and higher timeframes with confluence at the breakout.
Price is currently above the 50 SMA on all timeframes above the 15min and momentum is bullish per the RSI trading above the 55 level, adding to the bullish confluence
Looking to the ride the bullish wave from $42560 to $42920 where currently resistance level is sitting

US30: Strong Growth Ahead! Long!
My dear friends,
Today we will analyse US30 together☺️
The recent price action suggests a shift in mid-term momentum. A break above the current local range around 42,682.9 will confirm the new direction upwards with the target being the next key level of 42,855.1 and a reconvened placement of a stop-loss beyond the range.
❤️Sending you lots of Love and Hugs❤️

Buy for R/R1Buy or Buy Limit @ 42615
SL: 42377
TP1: 42850
Signal from a backtested strategy with a win rate of 60 %.
Manage your risk...

US30US30 is consolidating right now for another push up towards the highlighted box.
Disclosure: We are part of Trade Nation's Influencer program and receive a monthly fee for using their TradingView charts in our analysis.

DOW/US30 - PATIENLY WAITING FOR THE ENTRY - DO NOT RUSHTeam, we are already entry LONG NAS100 EARLIER.
But with the DOW, be patience
- waiting for 42000-419600 - will be our first entry ranges
Then if market continue to fall further - this is our back up entry at 41480-41220 - DOUBLE UP to kill the market
OK, i did follow Israel and Iran story
I have spent 4-6 hours research and analyzing the market.
I prefer to carefully entry the market. I want to ensure my continue winning.
Sometimes if it not in the trading setup - DO NOT TRADE.. that part of the risk management
Check out my new video how I did not lose a single trade last 90 days
A lot of videos NEVER show their history trade, always show win this win that.. but no show the statement or data. But I provide real account, real data.
Look forward to provide you more trades in coming.

US30 – Bearish Bias Amid Escalating Middle East TensionsUS30 – Bearish Bias Amid Escalating Middle East Tensions
U.S. indices, particularly the Dow Jones (US30), are under sustained bearish pressure due to intensifying geopolitical tensions between Israel and Iran. With no signs of de-escalation or negotiation, market sentiment remains risk-off.
Technical Outlook:
As long as the crisis continues, US30 is likely to maintain its downward momentum. The price appears set to test the 41770 level, with potential continuation toward 41310.
Only a clear signal of de-escalation or diplomatic engagement may reverse this trend, possibly triggering a recovery toward 42810.
For now, the directional bias remains bearish.
Key Levels:
• Pivot: 42160
• Support: 41770, 41310, 40700
• Resistance: 42410, 42810, 43210
Click to see the Previous idea

Dow Jones Breakout and Potential RetraceHey Traders, in the coming week we are monitoring US30 for a selling opportunity around 42,400 zone, Dow Jones was trading in an uptrend and successfully managed to break it out. Currently is in a corerction phase in which it is approaching the retrace area at 42,400 support and resistance area.
Trade safe, Joe.

US30 BULLISH BIAS RIGHT NOW| LONG
US30 SIGNAL
Trade Direction: short
Entry Level: 42,200.7
Target Level: 42,556.5
Stop Loss: 41,963.5
RISK PROFILE
Risk level: medium
Suggested risk: 1%
Timeframe: 6h
Disclosure: I am part of Trade Nation's Influencer program and receive a monthly fee for using their TradingView charts in my analysis.
✅LIKE AND COMMENT MY IDEAS✅

DowJones uptrend retest Key Support and Resistance Levels
Resistance Level 1: 43192
Resistance Level 2: 43620
Resistance Level 3: 44290
Support Level 1: 42100
Support Level 2: 41420
Support Level 3: 40990
This communication is for informational purposes only and should not be viewed as any form of recommendation as to a particular course of action or as investment advice. It is not intended as an offer or solicitation for the purchase or sale of any financial instrument or as an official confirmation of any transaction. Opinions, estimates and assumptions expressed herein are made as of the date of this communication and are subject to change without notice. This communication has been prepared based upon information, including market prices, data and other information, believed to be reliable; however, Trade Nation does not warrant its completeness or accuracy. All market prices and market data contained in or attached to this communication are indicative and subject to change without notice.

DOW JONES INDEX (US30): Pullback From Support
US30 shows some strength after a test of a key intraday support.
A cup and handle pattern on that and a violation of its neckline
indicate a local strength of the buyers.
I expect a pullback to 42550
❤️Please, support my work with like, thank you!❤️
I am part of Trade Nation's Influencer program and receive a monthly fee for using their TradingView charts in my analysis.

DOW/US30 - TIME FOR RECOVER DURING UK MARKET OPENINGTeam, very sad day to see Israel missle flying
We can only hope the world in peace
We are now finding opportunity to entry LONG DOW/US30
Please set your target 1 and 2 ranges
Make sure take 50-70% at first target and bring stop loss to BE
then second target
Please review the chart carefully and pricing target
Good luck.

US30 Breaks Trendline Support – Will Geopolitics Add FuelUS30 (Dow Jones) — Trendline Breach & Rising Geopolitical Risk
Technical Outlook — 13 June, 2025
Current Market Condition:
US30 is currently trading at 42,339, showing early signs of risk-off sentiment following a clear break of both the ascending trendline and the Previous Day Low, with price rejecting from the 42,863 supply zone. This sharp decline aligns with growing tensions between Iran and Israel, which are weighing heavily on investor confidence. The breakdown suggests a shift in momentum, with further downside likely if key support levels fail to hold.
Key Technical Highlights:
Major ascending trendline support has broken, indicating a structural shift toward bearish sentiment.
Price broke below both the Previous Day Low (42,551) and Fib support, invalidating short-term bullish setups.
EMA 50 was lost, and price is heading toward the 200 MA at ~42,100.
Stochastic shows strong bearish momentum, currently in a downward cross and nowhere near oversold.
Major downside levels: 42,100, 41,900, 41,700, and 41,500.
Upside resistance: 42,550, followed by 42,863 and 42,970.
🌍 Geopolitical Factor – Iran-Israel Conflict:
The recent escalation between Iran and Israel has intensified risk aversion across global markets. Defensive sectors are gaining while equity indices like the Dow Jones face increased selling pressure. With concerns over possible oil supply disruptions and global uncertainty, traders are pulling capital from equities and seeking safe-haven assets like gold and bonds.
The volatility spike from this geopolitical conflict may overshadow technical setups, amplifying moves and reducing the reliability of support/resistance zones unless confirmed with volume.
Trade Plan:
🔻 1. Bearish Continuation Setup (Short Bias) – Most Probable
Trigger: Retest of 42,550 fails (previous demand turned supply)
Target: 42,100 → 41,900 → 41,500
Stop Loss: Above 42,600
⚠️ 2. Pullback Bounce (Short-term Buy) – Less Probable
Trigger: Strong bounce from 42,100 with bullish divergence on Stochastic
Target: 42,550 → 42,700
Stop Loss: Below 42,000
Risk Management Note:
Due to the unfolding Middle East conflict, markets may behave erratically and spike unpredictably. Use smaller position sizes, widen SL buffers slightly, and stay alert to news headlines. Prioritize confirmation over anticipation.
📢 If you found this analysis valuable, kindly consider boosting and following for more updates.
⚠️ Disclaimer: This content is intended for educational purposes only and does not constitute financial advice.

US30 Analysis: Liquidity Dip or Deeper Correction?📉 US30 (Dow Jones) Trade Idea 📉
Currently analysing US30 – the Dow Jones Index 🏛️, and there are some key developments worth noting…
On the 4-hour timeframe, we’re observing a clear shift in market structure, with price breaking through previous lows ⚠️. This raises two possibilities:
🔹 It could be a liquidity grab before a rally 🚀
🔹 Or, it may be the beginning of a deeper end-of-week sell-off targeting levels below 🔻
At this stage, I’m watching for a potential counter-trend short position — but only if the conditions outlined in the video are met with precision 🎯.
🧠 As always, it’s about waiting for confirmation, not jumping in early. Disciplined execution is key. 🧩💼
⚠️ Disclaimer: This is not financial advice. The information provided is for educational purposes only. Always do your own analysis and manage risk accordingly.

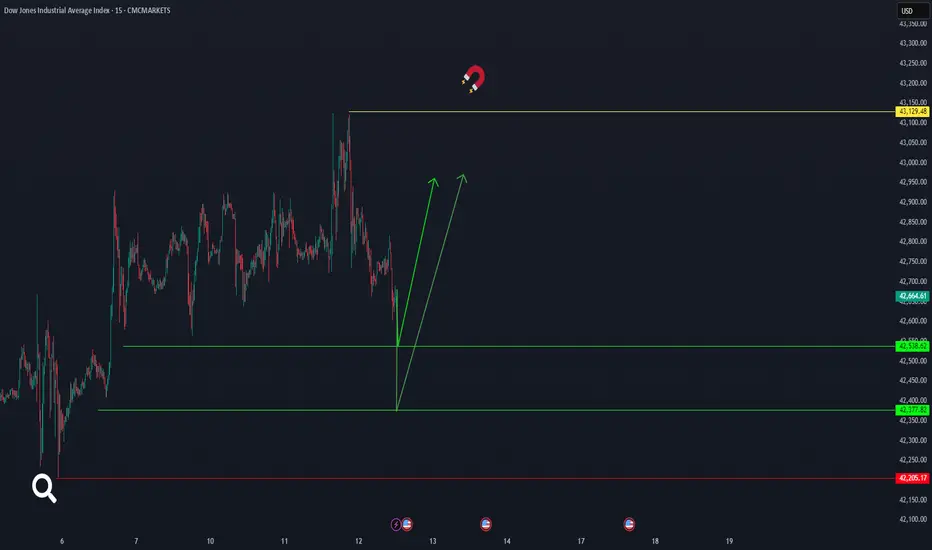
us30It seems that the Dow Jones will start moving again from the areas of 42377 or 42538 and the price will definitely reach 43129.48. Of course, the critical point is 42205. CMCMARKETS:US30
US30 Breakout Watch: 43,300 or Bust?US30 (Dow Jones) — Price Tests Key Fib Support with Breakdown Risk
Technical Outlook — 12 June, 2025
Current Market Condition:
US30 (Dow Jones Industrial Average) is currently trading around 42,661 on the 4-hour timeframe, up +0.17% for the session. After rejection at the Previous Day High (43,121), price is now pulling back and testing the Previous Day Low around the 42,660 region, which also aligns with a Fibonacci confluence zone and the 50 EMA. This zone is acting as a last line of defence for bulls — if held, a push toward new highs remains on the table. However, a confirmed break could see the index slide further toward deeper support levels.
Key Technical Highlights:
Price is testing a major fib-based support cluster around 42,600–42,700, aligning with the Previous Day Low and 50 EMA.
The Stochastic Oscillator has crossed bearish from the overbought region and is now heading down, indicating short-term bearish momentum.
Resistance is now PDL and next one at 43,121 (PDH) and a break above this level would confirm bullish continuation.
Trade Plan:
✅ 1. Bullish Breakout (Long) – Most Probable if Support Holds
Trigger: Bullish candle or engulfing pattern above 42,660–42,700 zone with volume confirmation
Target: 43,121 (PDH) → 43,300
Stop Loss: Below 42,500
⚠️ 2. Bearish Rejection (Short) – Viable if Fib Zone Breaks
Trigger: 4H candle closes below 42,600 with bearish confirmation
Target: 42,300 → 42,100 → 41,900
Stop Loss: Above 42,800
📉 3. Dip Buy Setup – Least Probable but High RR Opportunity
Trigger: Price dips into 42,100 or 41,900 zone and forms a strong bullish reversal pattern (e.g., pin bar, bullish divergence on Stochastic)
Target: Bounce back toward 42,600–42,800
Stop Loss: Below 41,800
Risk Management:
Use conservative lot sizing and set clear stop losses to avoid whipsaw risk. With macroeconomic data and news expected this week, watch for volatility spikes. Always let the setup confirm before entry, especially near fib-based support or resistance zones.
📢 If you found this analysis valuable, kindly consider boosting and following for more updates.
⚠️ Disclaimer: This content is intended for educational purposes only and does not constitute financial advice.

DowJones INTRADAY important support retest Key Support and Resistance Levels
Resistance Level 1: 43190
Resistance Level 2: 43620
Resistance Level 3: 44290
Support Level 1: 42100
Support Level 2: 41420
Support Level 3: 40990
This communication is for informational purposes only and should not be viewed as any form of recommendation as to a particular course of action or as investment advice. It is not intended as an offer or solicitation for the purchase or sale of any financial instrument or as an official confirmation of any transaction. Opinions, estimates and assumptions expressed herein are made as of the date of this communication and are subject to change without notice. This communication has been prepared based upon information, including market prices, data and other information, believed to be reliable; however, Trade Nation does not warrant its completeness or accuracy. All market prices and market data contained in or attached to this communication are indicative and subject to change without notice.

Dow Jones Potential UpsidesHey Traders, in today's trading session we are monitoring US30 for a buying opportunity around 42,100 zone, US30 is trading in an uptrend and currently is in a correction phase in which it is approaching the trend at 42,100 support and resistance area.
Trade safe, Joe.
