Market Dynamics: Large Players Enter as Price Reaches Highs
The price has been on a significant bullish rally, breaking historical highs. This suggests that the price has encountered strong buying interest, indicating the presence of buy-side liquidity. From a technical perspective, this suggests that a retracement may be imminent.
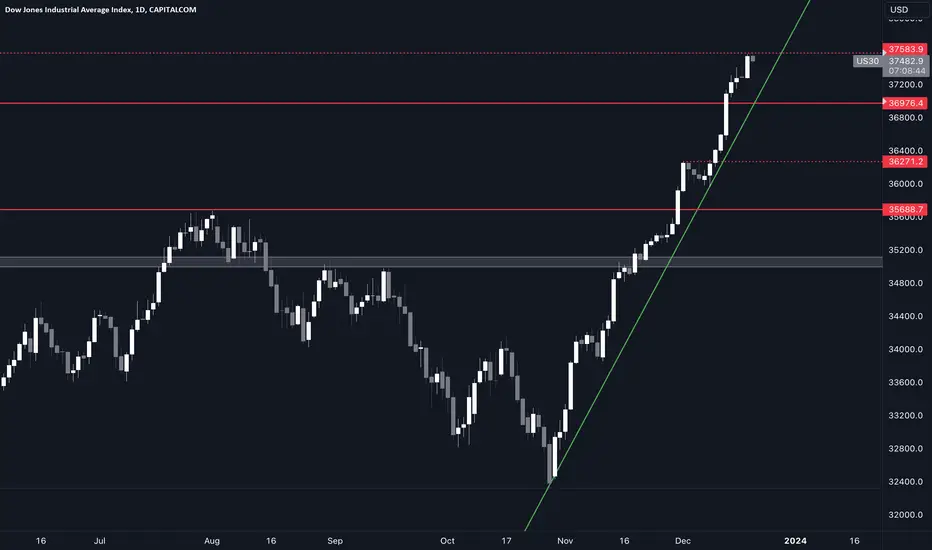
As further confirmation, on the daily chart, we can see that the price reached the liquidity of its previous high and swiftly reversed, creating a breaker pattern. If the price continues to decline, it is likely to experience a shallow retracement to prevent buyers from recovering all their losses.
Additionally, in the highlighted area, we can clearly observe a decrease in buying activity and an increase in aggressive short positions. This could be an indication of the involvement of institutional or large traders, and it's something to keep a close eye on.
Furthermore, the catalysts scheduled for tomorrow add more weight to the possibility of a correction. In my experience, this type of price action often occurs before significant market-moving events. A significant correction is highly probable.
For setting stop-loss (SL) levels, I've shared both aggressive and conservative ideas. I've also provided take-profit (TP) levels based on Fibonacci retracement levels at -272 and -618, with the last one indicated by the white line on the chart.
Please note that trading involves risks, and it's essential to use proper risk management techniques and consider your own trading strategy and risk tolerance when making trading decisions. This analysis is for informational purposes only and should not be considered as financial advice.
Us30analysis

US30 TECHNICAL ANALYSISHere I provide my technical analysis for us30 and I will be looking for an easy and straight forward break and retest for my key levels.

US30/WALLST 30Waiting for price to reach at 34200 zone. if price has a momentum we trade it buy.
stops at 32800.
nothing is perfect on this idea.
Trade at your own risk.
Follow for more daily updates and market analysis.

US30USD Longs from 36600.0 back upThis week's analysis for US30 is distinctly bullish, given its aggressive surge past the all-time highs (ATHs). I believe there's further upside potential, providing traders with opportunities to explore nearby long positions for potential gains. In the provided image, I've identified three potential demand zones where I'll be looking for an accumulation.
Among the identified zones, the first is the 4-hour demand zone, situated closest to the current price. To maximise the potential for a positive bullish response, I am particularly inclined towards the areas surrounding the 11-hour or 8-hour demand zones at the bottom, deeming them as the most optimal zones.
Confluences for US30 Buys are as follows :
- Overall market trend on higher time frame as well as lower time Frame remains very bullish.
- There are no additional supply zones above that the price can respond to, only demand zones where we can anticipate another upward rally.
- So much liquidity to the downside that price has left including imbalances, asian lows, and trend lines.
- Three clear demand zones have been established in close proximity to the current price, and it is highly probable that the price will exhibit a reaction from these zones.
- Candle sticks on HTF are still very bullish carrying a lot of strong momentum which indicates buying pressure is still not yet exhausted.
P.S. Despite the robust bullish performance of US30, marked by its attainment of all-time highs (ATHs), it wouldn't be unexpected for the price to initiate a bearish trend. This expectation is rooted in the substantial liquidity and imbalances that remain below. However, considering the absence of a significant CHOCH to the downside, I maintain a strong bullish stance on the market at present.

US30 DOW JONES Technical Analysis And Trade Idea The US30 has exhibited a strong upward movement, recently reaching a significant resistance level on both the daily and weekly charts. This video provides a detailed analysis of this trend, meticulously examining price movements and identifying possible trading opportunities by thoroughly assessing multiple timeframes, ranging from weekly to as short as 15 minutes. Anticipate an in-depth review covering price variations, market trends, trend evaluations, and crucial technical analysis components. It's crucial to emphasize that the insights shared here are purely educational and should not be interpreted as financial advice.

US30 Daily Projection In daily time frame price going retest the major support area . If price reject this zone and close above then buying favorable.

US30US30 trading in a range and I will be waiting for a breakout for both sides of the rectangle pattern which is now in play.

US30/USD Shorts from 36600.0 back down.Last week's price action exhibited significant ranging, mainly influenced by the proximity to all-time highs (ATHs). My current perspective is that US30 is actively generating liquidity, setting the stage for a bearish reaction once the daily supply is mitigated. This particular supply level holds substantial importance as it is the last on the chart, existing on a higher time frame and having broken structure to the downside. I anticipate a scenario where the price sweeps the top of the consolidation, touches my Point of Interest (POI), and subsequently descends towards the lower bounds of the consolidation and potentially even lower.
Given the post-Non-Farm Payrolls (NFP) situation, I foresee a breakout from this range, initiating a trend and providing opportunities for traders like us to capitalize on. My strategy involves patiently waiting for a Wyckoff distribution to take shape in this zone, allowing us to secure a precise entry point for our bearish positions.
Confluences for US30 Sells are as follows:
- Price is near daily supply which has caused a BOS to the downside on the higher timeframe.
- There lots of liquidity lying below in the form of EQLs, Asia Lows, and trendline liquidity.
- The bottom part of the consolidation also holds lots of liquidity so we can target as T.P levels
- Wyckoff distribution is pending and still hasn't been formed yet on lower time frame.
- NFP event has also passed so now we could possibly see the real moves play out.
- Price has been very bullish recently and now bullish pressure is getting exhausted.
- This consolidation is a great sign that price might be looking to reverse soon.
P.S. I acknowledge the possibility of the price breaking the bottom first and interacting with a demand zone, triggering a bullish rally that could eventually exhaust the supply. It highlights the importance of adaptability. I'm closely monitoring multiple potential scenarios and adjusting my approach based on the direction the price may take. This approach enables us to identify more frequent opportunities in the market.

US30USD ShortThe price is on a ranging mode, as indicated in the chart and we will wait until the index shows an opportunity in trading.
Meanwhile, my perspective as for now is that the price might fill in the imbalances caused by the bullish market earlier on and my target would be 35960

US30USD ShortWell, the price has broken the resistance zone aggressively, and I anticipate that the price will continue with bearish momentum.

US30/USD Longs from 36000.0 up to 36750.0US30 has followed the anticipated trajectory, and I foresee it reaching all-time highs (ATHs) very soon. However, given the recent impulsive upward movement in price, a pullback is likely imminent. This presents an opportunity for us to capitalize on, considering the presence of an 8-hour demand zone where the price could retreat to, regaining bullish momentum for another rally.
Conversely, there's also a possibility of the price surging directly into our daily supply zone, prompting a bearish reaction. While I anticipate the eventual failure of the daily supply, I can foresee price declining from that zone, providing potential selling opportunities.
Confluences for US30 Buys are as follows:
- Price has been impulsively bullish to the upside carrying lots of momentum.
- Overall trend on the higher time frame and lower time frame both show a bullish trend.
- Price left an 8hr demand zone for us to take buys from up to the ATH's
- Due to recent impulsive upward movements, a pullback in price is imminent.
- For the price to gather sufficient strength to reach all-time highs (ATHs), it must retrace back to a nearby demand zone.
P.S. As the price approaches all-time highs (ATHs), it wouldn't be surprising to witness a consolidation. In such a scenario, I anticipate a significant reaction from the daily supply, given its HTF significance. Conversely, should the price quickly exceed the latest supply zone, choosing buy positions would be a more feasible approach.
HAVE A GREAT TRADING WEEK AHEAD!

US30USD LongThe index has been having a strong bull run for the past few weeks, and I am anticipating that the run will continue.
According to the client sentiment analysis, it seems most traders are selling this index - 78%, and I am predicting that the price might move in their favor.
My entry point is 35400, TP at 35700, and SL at 35250.
My target R: R is 1:2
Note - Only risk 1% of your trading account.

US30 Longs from 35100.0 up towards 35600.0My bias for US30 is bullish, hence why we are looking forward to the nearest buy opportunity which will be the 14hr demand below. This zone has caused a BOS to the upside meaning once a correction back down is complete, it will hopefully mitigate our POI where we will be able to enter buy positions. But we must wait for our lower time frame confirmations like Wyckoff.
There's a long wick that hasn't got filled in which I see as liquidity hence why I haven't got any near by supply zones however, we can catch buys up to that (7hr supply) so we can eventually sell back down. Nevertheless, price could go lower as price has been very impulsive and it has left quite a few imbalances below. So we could see a mitigation of a cheaper zone like the 10hr.
Confluences for US30 Buys are as follows
- Overall Market trend (short term and long term) is both bullish, matching my bias.
- For price to keep going higher it must create a pull back in order to create a new leg.
- Price has CHOCH and caused several BOS to the upside confirming the trend.
- Liquidity has been swept already so there's enough momentum for price to push upwards.
- Price left a 14hr demand at a psychological level of 1990 that caused an impulsive move up.
- Pending Wyckoff accumulation to play out as price is not near my POI as of now.
P.S. I don't personally see a current near by supply to take sells from so I would rather wait for price to "show me its hands" and take it from there. In addition to this, Price is between a lot of liquidity right now and we might just see a consolidation but, we have to always remain adaptive hence why we have spoken about both scenarios that could play out.

DOW JONES 💸 DOW JONES 💸
Chart : 1Hour
Overall Trend : Bullish
Current Market Structure : Consolidation
Scenario 1 :
•Market is overall bullish , let’s see if our 1H demand area holds & is respected . For possible Longs positions taken if the SWING LOW is not Broken , Targeting 35100 .
Scenario 2 :
• If we do get a break BELOW our swing low , we could look for possible Short positions in the market . Anticipating price to fill the imbalance in the market . Target being 34400.

US30/USD Shorts down towards 34400.0 (possibly lower)From my US30 analysis we are currently approaching a key level of supply, even though we are very bullish the market requires a pull back in order to mitigate the inefficiencies left below, Hence why I am temporarily bearish this week. I see price reacting from the daily supply and dropping towards 34400.0 or even lower to more discounted zones in order for price to continue in its bullish trend upwards.
As of current price I would be waiting for a distribution to play out on the lower time frame and a clean CHOCH because we will be counter trend trading back down. As of my designated target, there is lots of imbalances as well as liquidity in the form of asian lows.
Confluences for US30 Shorts are as follows:
- Price about to tap into a daily supply zone that has caused a BOS to the downside.
- Current price has swept lots of liquidity (EQHs) and has taken out swing highs just below.
- Price is premium so it's ideal to sell from this daily supply zone that we are approaching.
- Lots of liquidity to the downside as well as imbalances that needs to get taken.
- Price has been moving bullish and requires a pull back if price wants to continue in uptrend.
- Price is slowly distributing before the mitigation of zone but pending a clean CHOCH.
P.S. we are at the top of this internal structure that has caused a huge break of structure to the downside in which price is more probable to react from. As we have entered a premium POI I would be looking at imminent sells soon as possible once my confluences are met.

US30 presents temporary sideways fluctuationHello everyone,The index price recently surrendered to the control of the sideways tilt, despite its repeated positioning within the axes of the ascending channel, to be affected by the strength of the additional barrier positioned at 35120. We note that it recently presented a weak sideways fluctuation by settling at 35000.
We would like to remind you of the importance of the stability of the support for the ascending channel extending towards 34910, so that this increases the chances of the price exceeding the previously mentioned barrier, and by achieving the required breakthrough, trading will extend directly towards 35255 and 35490. As for the price falling below the support and presenting it to a negative close, this will force it to activate the downward corrective path, so we expect it to incur many losses that may begin.
Resistance prices: 35254 & 35442 & 35699
Support prices: 34728 & 34469 & 34084
The general trend expected for today: bullish with stable support

US30 DJI on 20-11-2023 : BEARISH BIASEDUS30 Index can go Bullish if,
H1/H4 closing happens above 35000, it can move bullish upto 35150 level.
or it can go Bearish if,
H1/H4 closing happens below 34880, it can move bearish upto 34730 level
#️⃣ Trend expectations from 8:00AM to 12:30PM USA Time EST.
#️⃣ Trade with 1-2% risk only.


US30 confirms the positivityHello everyone, Despite the weakness of recent trading in the index price and its fluctuation near 35050, its positioning within the axes of the ascending secondary channel shown in the attached drawing and the stability of the support represented by the level of 34728 confirms the positive continuity for the upcoming trading.
Currently, with the Stochastic indicator presenting positive momentum as it rushes towards the 80 levels, the price will be able to overcome the stable barrier at 35050, opening the door to reaching additional stations, which may start from 35245 and reach about 35442 in the medium-term trading.
Pivot Price: 35050
Resistance prices: 35254 & 35442 & 35699
Support prices: 34728 & 34469 & 34084
The general trend expected for today is bullish

US30 forecast, shortThe Dow Jones Industrial Average (DJIA), Dow Jones or the Dow for short tracks the performance of 30 of the biggest companies in the US including Boeing, Intel, and Dow. It’s often used as a barometer for the overall performance of the country’s equity markets. Historically it’s one of oldest and most followed indices. The chart is a useful measure of US economic health. Follow the Dow Jones live with the real-time chart and view the latest Dow forecasts, news and analysis. Key pivot points and support and resistance will help you trade the Dow Jones today and into the future

US30 Dow30 DJI on 16-11-23 >> BULLISHUS30 can move on Bullish Bias on 16-11-23 if any H1/H4 closing happens above 35050 level upto 35500 level.
Alternatively, if any closing happens below 34850 level, then it may go bearish upto 34500 level.
For more details ,reach us . Thank you

US30 (Achieves goals)hello everyone,Yesterday, the index price formed a strong upward attack by exceeding the additional stable barrier at 34738 , achieving significant gains by attracting towards 34985 . We currently confirm that the price is adhering to the bullish scenario and by trying to form the 34738 level for new support. The bullish bias calls us to wait for recording new gains starting from 35254.
Also, the continued fluctuation of the Stochastic indicator within the overbought level will reduce the chances of the price forming any bearish corrective bounce before reaching the previously suggested additional target.
Pivot Price: 34738
Resistance prices: 34985 & 35254 & 35565
Support prices: 34395 & 34084 & 33688
