US30 ends the downward pathUS30
The index price confirmed that it recently exceeded the 33880 level, announcing the end of the downward path. We note that it is currently attacking the neck level centered at 34011 to try to find an outlet to restore the upward bias again.
if the price stable under 33880 then the movement will be between 33696 and 33500
Pivot Price:33880
Resistance Price: 34011 & 34197 & 34372
support price: 33696 & 33500 & 33264
The general trend expected for today: bullish if the condition is met
timeframe: 4H
Us30analysis

US30 4H Attracted towards the barrierUS30
stabilizing prices above 33590 will support raising to touch 33768 and 33957 ,334168
if the price stable under 33590 then the movement will be between 33431 and 33259
Pivot Price:33590
Resistance Price: 33768 & 33957 & 334168
support price: 33431 & 33259 & 32458
timeframe: 4H

US30 IDEASo far the overall movement of US30 is bearish.
Price might be heading to the HTF LH, meaning that the current bullish trend is because price is reaching for the HTF LH and until it breaks it then the overall bearish trend will be broken.
I'm trading the bull run on the LTFs.
Predicted movements:
wave 1, 2 and 3

US30 Dow Jones Technical Analysis and Trade IdeaWe are presently analysing the US30, which has recently reached a critical resistance level. In the video, we conduct a comprehensive analysis of the Dow Jones, delving into various aspects including the prevailing trend, support and resistance levels, market structure, and price action dynamics. As the video nears its conclusion, we carefully assess a prospective trading opportunity.
It is important to emphasise that our video provides a thorough explanation of all aspects discussed, and it should be noted that the content is provided for educational purposes only. This should not be interpreted as financial advice.

US30 4H No change to the negativity US30
The DowJones Market lost 1% in the first moment during the market opening
stabilizing prices above 33110 will support raising to touch 33328 and 33532,33768
if the price stable under 33110 then the movement will be between 32819 and 32651
Pivot Price:33110
Resistance Price: 33328 & 33532& 33768
support price: 32819 & 32651& 32458
The general trend expected for today: bearish
timeframe: 4H

US30 Top-down analysis Hello traders, this is a complete multiple timeframe analysis of this pair. We see could find significant trading opportunities as per analysis upon price action confirmation we may take this trade. Smash the like button if you find value in this analysis and drop a comment if you have any questions or let me know which pair to cover in my next analysis.

US30 He clings to negative attemptsUS30
stabilizing prices above 33110 will support raising to touch 33328 and 33532,33768
if the price stable under 33110 then the movement will be between 32819 and 32651
Pivot Price:33110
Resistance Price: 33328 & 33532& 33768
support price: 32819 & 32651& 32458
The general trend expected for today: bearish
timeframe: 4H

US30 ANALYSISOverall we are still bearish , will be looking for sell set ups , Market is currently in its pull back phase . well be patient enough to wait for this set up to play out , short term buys can be taken (risky as you are going against the trend ) . Will be looking to target 33000 ( DEMAND ORDER BLOCK ) .

US30 4H (Pivot Price:33550)US30
stabilizing prices above 33550 will support raising to touch 33825 and 34372
34584
if the price stable under 33550 then the movement will be between 33354 and 33156
Pivot Price:33550
Resistance Price: 33825 & 34372 & 34584
support price: 33354 & 33156 & 33004

Us 30 sell side deliveryPrice continue to drop and levels are being mitegated.am still expecting bearishness till bisi is sweeped

US30 Catalytic xoneCurrently, the price is exhibiting a strong bearish momentum, and I've noticed a chart pattern breakout below the 34,000 level. To capitalize on this downward trend, I'm considering a retracement entry near 33,920. This level provides an attractive entry point to join the market as it aligns with the prevailing bearish sentiment. Keep a close eye on this setup for a potentially profitable trade."
Remember to conduct thorough analysis and risk management before executing any trades.

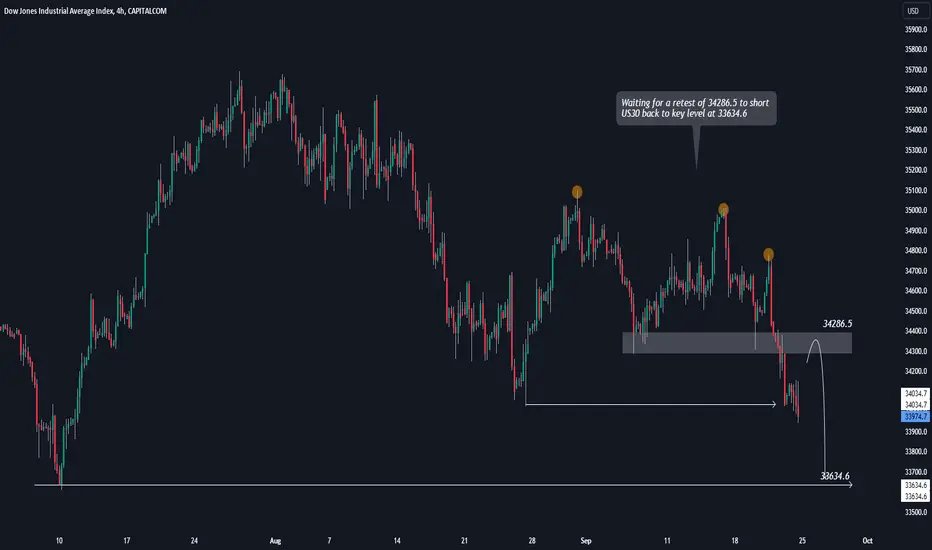
US30 SHORT - FOLLOW THE MOMENTUM!Waiting for a retest of 34286.5 to short US30 back to key level at 33634.6
If you agree drop a like and if you have any questions leave a comment :)
DowJones Broke an Important Support ZoneAbove is a technical overview of the US30 and the key areas to keep an eye on. Dowjones broke an important support zone and retesting again. In case of a fake out then it could turns back into the trend, and may go to the 35000$ - 35300 range. The Second Scenario If it fails to re-enter into the trend, it will fall further to 34000.

US30 DOUBLE TOP INSIDE A DOUBLE TOP ?it looks like us30 dow jones broke market stucture / did a change of character on Daily and weekly:
on weekly lower high forming double top
on daily almost equaly hight double top formed
the break out of the bullish trendline and the key level will probably arouse a bearish move.
wait for the news please.
this is just my opinion not financial advice.

US30 4H OUTLOOK US30
Analyze
The FED decision will affect the market, rising 0.25% it means will support bearish till 34428,
Decreasing the rate or like the previous rate will support rising till 34817
Currently, consolidation above 34583 will support them to rise up again and will continue the positive attacks to the suggested targets 34817 and possibly 35051
as for renewing bearish attempts, consolidation under 34583 will open the way to lose more and more points to reach 34428 and 34165
the expected trading range for today is between the support line 33444 and resistance line 35674
Support line: 34428, 34165, 33951
Resistance line: 34817, 35051, 35377
timeframe: 4H

NAS100 and US30 Top-down analysis Hello traders, this is a complete multiple timeframe analysis of this pair. We see could find significant trading opportunities as per analysis upon price action confirmation we may take this trade. Smash the like button if you find value in this analysis and drop a comment if you have any questions or let me know which pair to cover in my next analysis.

Dow Jones (DJI) -> Back To The TrendlineMy name is Philip, I am a German swing-trader with 4+ years of trading experience and I only trade stocks , crypto , options and indices 🖥️
I only focus on the higher timeframes because this allows me to massively capitalize on the major market swings and cycles without getting caught up in the short term noise.
This is how you build real long term wealth!
In today's anaylsis I want to take a look at the bigger picture on Dow Jones.
At the moment the Dow Jones is retesting its previous all time high which is roughly at the $35.500 level and the index is already starting another bearish rejection.
If we see a retracement back to the lower bullish trendline of the rising channel which is sitting at the $30.000 level, this will be a textbook bullish continuation setup on the Dow Jones.
- - - - - - - - - - - - - - - - - - - -
I know that this is a quite simple trading approach but over the past 4 years I've realized that simplicity and consistency are much more important than any trading strategy.
Keep the long term vision🫡

Short US30Simply following the market structure.
- OB
- Choch
- BOS
- Liquidity
(Very late entry)
I am bearish until the price reaches the monthly buy zone

NAS100 and US30 Top-down analysis Hello traders, this is a complete multiple timeframe analysis of this pair. We see could find significant trading opportunities as per analysis upon price action confirmation we may take this trade. Smash the like button if you find value in this analysis and drop a comment if you have any questions or let me know which pair to cover in my next analysis.

US30 ANALYSISTrend for the day is bullish , we trade in alignment with the trend as we are looking for possible buys in the market .
We have two potential demand areas to look at for buys ... entering with confirmation only . If set up is not respected we will adapt to the market structure but for now we are looking to buys

US30 4H (try to rise up)US30
Analyze
currently, consolidation above 34583 will support them to rise up again and will continue the positive attacks to the suggested targets 34817 and possibly 35051
as for renewing bearish attempts, consolidation under 34583 will open the way to lose more and more points to reach 34428 and 34165
the expected trading range for today is between the support line 33444 and resistance line 35674
Support line: 34428, 34165, 33951
Resistance line: 34817, 35051, 35377
timeframe: 4H

US30 Dow Jones Technical Analysis and Trade IdeaIt's evident that the US30 index has been confined within a tight trading range from the latter part of the Asian session leading up to the London Open. In the preceding week, we observed a notable price surge toward a critical resistance level, but that advance was met with resistance, and now the index appears to be consolidating sideways.
I'm actively scouting for a prospective trading opportunity for the upcoming week, and examining the chart to pinpoint the likelihood of an early-week stop run. If such an occurrence materialises, it could serve as an advantageous intraday trading opportunity. Please be aware that all comprehensive explanations are provided in the accompanying video, and it is crucial to note that this analysis should not be construed as financial advice.

US30 - DOW JONESThe price action is coming down to fill the Sunday GAP from 2 weeks ago. Once the GAP is closed, look for a BUY entry in that zone provided.
Happy Trading!!
Comment your thoughts below.
Thanks,
#PapaPips
