US30 SHORT Term Trading IdeaHello Traders
In This Chart GOLD HOURLY Forex Forecast By FOREX PLANET
today Gold analysis 👆
🟢This Chart includes_ (GOLD market update)
🟢What is The Next Opportunity on GOLD Market
🟢how to Enter to the Valid Entry With Assurance Profit
This CHART is For Trader's that Want to Improve Their Technical Analysis Skills and Their Trading By Understanding How To Analyze The Market Using Multiple Timeframes and Understanding The Bigger Picture on the Charts
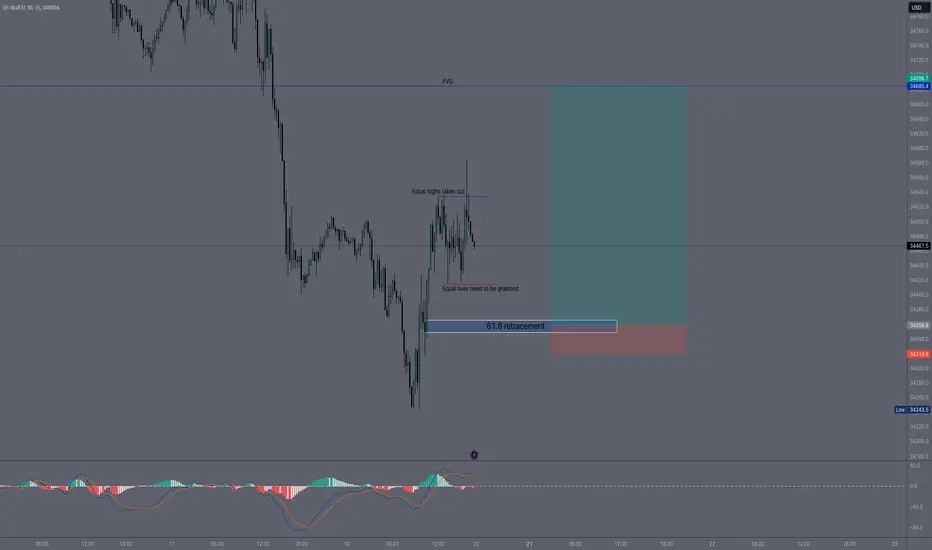
Us30analysis

I'M BACK! How to play my chart:
Buy at support TP's (green), sell at resistance TP's (red). When you open this chart you'll see a green entry and a red entry. When the candlestick hits the green entry, you place a buy. If however that support buy doesn't go into profit and goes negative -35 or -60 pips (depending if it was a fast break/or if the break landed on a minute 15 zone), if it breaks you would then exit your buy and immediately enter the sell. You would then ride that sell down to green TP1, or you could then repeat and play the buy/break there.
The same exact thing goes for resistance sell/break plays!
All likes/comments and feedback are very much appreciated!

US30 is moving forwardWe have shared a trade setup last week, according to that, It' is giving some entry points !

US30/DJ30/WALLST UPDATES
Hello traders , Since this posted. price exactly goes at bottom, PRice reacts in the last sesssions last friday, im expecting bounce back at the last point of supply or it will dive back to below to our main trendline.
This idea base on the wyckoff supply sell off.
If price goes back to the supply zone. Then we might see a sell off again.
if not. and they reaccumulate on the previous friday low. then we might see our original idea at 16000 price target..
Trade at your own risk. exact numbers are for reference only
.
This is not a financial advice.
Follow for more daily updates

DJ30 CLEAR BULLISH SIGNAL Hello traders so after doing a brief analysis of dj30 i found that we might be seeing a bullish move soon here is why :
last week : i predicted that the price will go down to the 34200 support level and that is what happened as predicted a bearish move where the price reached the 34200 support.
but the 34200 support level is actually a neckline of a inverted h&s on the daily and weekly tfs that the price has been forming for a while.
the price not only broke this neckline but also camedown to retest it giving us a clear bullish signal.
also the daily candle of friday closed as a hammer on top of the support level indicating futher chances that a bullish move is incomming .
thank you for reading this is nothing but my humble opinion and not financial advice , trade safe.

US 30 LONG Risk 0.5%
TP1 = 1:2 RR
Disclaimer:
The contents in this Idea are intended for information purpose only and do not constitute investment recommendation or advice. Nor are they used to promote any specific products or services. They serve as an integral part of a case study to demonstrate fundamental concepts in risk management under given market scenarios. A full version of the disclaimer is available in our profile description.

US30 - SHORT🎉 Exciting News, Traders! 🎉
Get ready for a potentially fantastic trade opportunity on US30! 🚀📈 We've been closely watching the charts, and guess what? We're right on the brink of a significant movement!
Let's navigate these markets together and make the most of this trade setup! 🚀💪 Happy trading, everyone! 📈🤑
🎯 Key Level Alert: We've marked a crucial level on the US30 chart, and the market seems to be gearing up to hit it. 📊🔍 This could be a game-changing moment for us.
Stay patient and stay focused! 🕐 The markets can be unpredictable, but with careful analysis and smart strategies, we're all set to make the most out of this setup. Remember, success in trading comes from staying disciplined and informed

US30/WALLST/DOWJONESSo we are in a downplay moves on US30, but we might see a good rally upto 16400 zone for a possible supply of 2021.
This idea base only my understand on current market structure, this is not a signal. this chart are for reference only in the future. maybe we could wait on short zone.
This is not a financial advice follow for more.
Thank you to all new followers.
400+ is too much for me.
thats why I keep posting any chart ideas that has a value to me.
The understanding on market sentiment at this moment is double, most of them bearish but there are still some bullish.
So we only anticipate what is in the given chart being reported.
Conclusion:
The market sentiment surrounding Wall Street 30 stocks is a dynamic interplay of positive, neutral, and bearish factors. Investors are closely monitoring technological advancements, consumer spending patterns, regulatory changes, and macroeconomic trends as they evaluate the potential performance of these diverse stocks. A well-rounded understanding of the sentiments within each industry can guide investors in making informed decisions within their portfolios.

US30 BULLISH ELLIOT BREAKDOWNLooking back from Wednesday 15 of March, 2023, the wave 3 kicked off after wave 2 has completed its 3 waves movement. Wave 3 which carries 5 sub-waves along side submerged. Sub-waves 1, 2 and 3 are done, going for the fourth wave which carries 3 waves (ABC waves). However, from 4H timeframe, we can see a Zig-zag correction occurring which goes with 5-3-5 formation. Wave 4 is almost done, from there we can witness the last wave of 5. let's see what the lunch from NASDAQ:AAPL will bring about on the 15th of September.
Stay tuned for updates from this breakdown.
WAVE 1 = 5 WAVES
WAVE 2 = 3 WAVES
WAVE 3 = 5 WAVES
WAVE 4 = 3 WAVES
WAVE 5 = 5 WAVES
WAVE A = 5 WAVES
WAVE B = 3 WAVES
WAVE C = 5 WAVES

Dow Jones is an investment opportunityHi, according to my Dow Jones analysis. The market is still positive. The indicator has exited the downward channel. Also, there is an uptrend. The market is now sideways. There is a high probability of a rally to the 3700 level. Good luck everyone

US30 ForecastAfter 3 weeks of being range, it seems us30 can fall towards 33% level, as a retrace for higher probable prices.

US30 1H (tendency: is bullish)US30
stabilizing prices above 35303 will support raising to touch 35683 and 35910
if the price stable under 35303 then the movement will be between 34984 and 34658
the condition is closing the 4H candle under
35303
tendency: is bullish
resistance price: 35683 & 35910 & 36098
support price: 34984 & 34658 & 34393
tendency: is bullish
timeframe: 4H

US30 POSSIBLE BEARISH MOVEhi traders so after doing a quick analysis on us30 it appears that it might be going down.
the price currently is at a pretty important / tricky zone
we have a trendline and a support level that we can call a neckline for the ugly head and shoulders pattern the price formed earlier .
we have a daily candle that closed as an inversed hammer rejecting the trendline .
and we also have the rsi who indicates a bearish divergence.
if the price rejects trendline and breakout the support we might see a big bearish move for us30.
this is not financial advice just my humble opinion trade safe !

Medium Term Key Levels for US30 (PMLs)These are my medium term key PMLs for US30. It is in a range at the moment.

TRADE IDEA ON US30 - BEARSWith the prevailing trend from the higher timeframe there is a possibility of a bearish continuation regardless of the aggressive correction seen. a break and probable retest of current candles low will confirm the projection for the bearish continuation

US30 Market BreakdownAs seen.
I am overall bullish.
So I follow what the market says.
I see:
- Choch in favor of bulls
- Liquidity to be taken in favor of bulls
- FVG to be filled
- OB in favor of bulls
I predict:
- Movement (1), (2) or (3):
Movement (1): Market will take on liquidity (2), fill the FVG and/or reach until the OB to continue rising.
Movement (2): Price will take on liquidity (1) creating a BOS and then falls until FVG and/or OB to continue rising.
Movement (3): shoot straight up

US30 LongsTrend is still bullish. Looking for pullback to complete, we will see from news reaction to the BRICS situation. Then a continuation to the upside depending on how candles form at 34750 QP level

US30looking bearish trend short term in 4h timeframe after breakout rising trendline then buy after compalte 4th wave

US30/WALLST35750 IS The top of this. I look at Weekly charts for this kind of trade.
With a Good spot on stoploss.
WIth higher Take profit zone. But this is not a signal, this idea are for reference only.
Trade base on your own decissions. Follow for more.
FOr daily FX market ideas and chart analysis.

Dow Jones -> Fighting The Little Brother NasdaqHello Traders and Investors ,
my name is Philip and today I will provide a free and educational multi-timeframe technical analysis of DowJones 💪
With the recent retest of a previous monthly resistance level, now turned support, and in confluence with a retest of the 0.382 fibonacci level the Dow Jones started a new bullrun which will certainly continue going into 2024.
On the weekly timeframe the Dow Jones just broke above a major previous weekly bearish trendline and since then created a solid +5% rally and with the recent bullish momentum I simply do expect the creation of a new all time high soon.
I have also been bullish on the daily timeframe on the Dow Jones for quite some time and so far everything payed off nicely - I am still waiting for a drop though to then scale into more buys on the Dow Jones to perfectly ride the next bullish wave.
Keep in mind: Don't get caught up in short term moves and always look at the long term picture; building wealth is a marathon and not a quick sprint 📈
Thank you for watching and I will see you tomorrow!
My previous analysis of this asset:

DeGRAM | US30 market previewUS30 reached a major resistance level.
Price action is testing the confluence level, which is the fibo extension level and resistance.
The market is in the supply zone, where it has dropped from this level before.
We expect a pullback from the resistance.
-------------------
Share your opinion in the comments and support the idea with like. Thanks for your support!

US30 Will Drop!after a failure swing when price couldn't reach 35392.58 price point and an obvious bearish engulfing all on the supply zone which indicate a potential retracement to 34955.92
