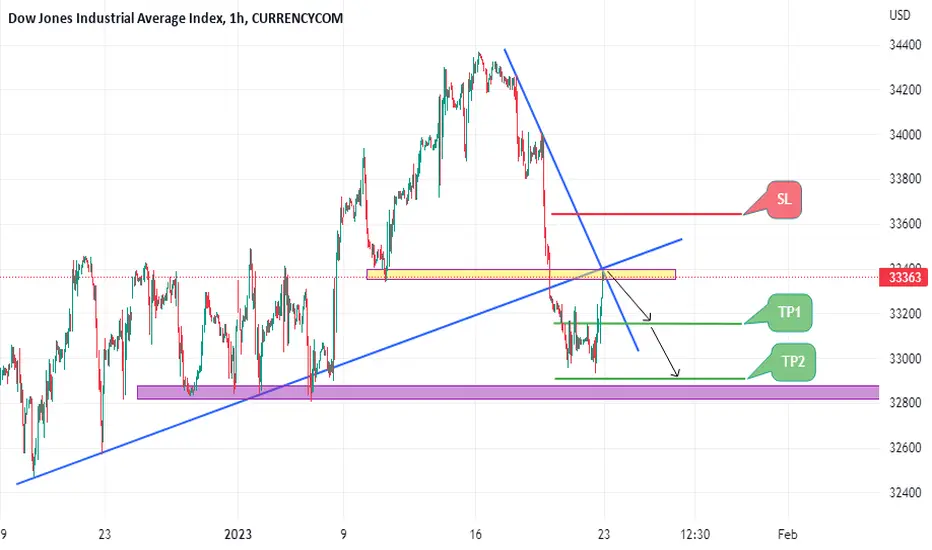
US30 ( High Probability SELL Setup TP HIT) Here we can see clearly how our previous post has worked perfectly according to our analysis,
Well Done to whoever took the trade with Us,
Keep a close eye on your trading plan,
Happy pip hunting traders,
FX KILLA.
Us30analysis

US30 BULLS 🐂🤑🚀Break of previous downtrend structure and a play out in the symmetrical triangle. Looking to see a rally to the up side once we break the triangle resistance line at around 34181 price. Triangle pattern respecting H4 and H1 TFs as well.

SHORT As you can see, it was a big drop. It was in a downtrend and went into an uptrend. This uptrend seems to have ended without Elliott Wave 5 being completed.Now there is a correction which will prompt him to find strength in the area again.

US30 1HHey traders, in today's trading session i'm are monitoring US30 for a buying opportunity around 33808 zone, once I will receive any bullish confirmation the trade will be executed.

US30(Dow Jones) : Short Trade , 1hUS30 sell Entry : 34050
Stop : 34484 , Target1 : 33618 , Target2 : 33181
Risk/Reward Ratio : 2
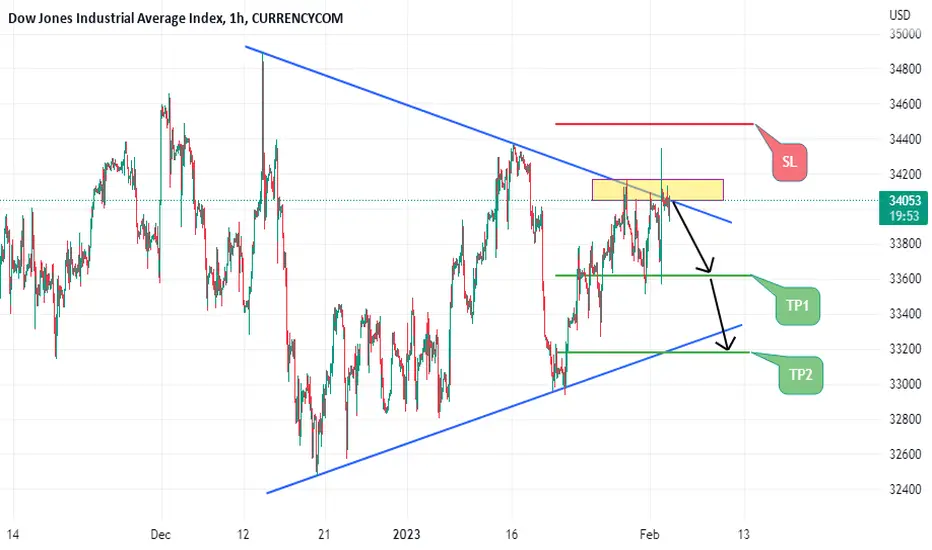
US30 (High Probability SELL Setup SOON)* Here We Can See Clearly the Next Moves for US30 Today,
* With the #FOMC Meetings Today at 7:30 pm ( GMT + 00:00 ) London Time, & The #FedChairJeromePowell is Expected to #RaiseInterestRates by Quarter pts, in an effort to reduces #Inflation,
* Hence We Expect to Drop The U.S. Indices,
* We're Using HTF for a Clearer view Of Our Analysis, Hence we can't predict the Duration of the Moves in the Market,
* We've Got Our EP (Blue Line) & our TP (Golden Lines),
* Keep your Eyes Close on U.S. Indices Today for a Better Trading Opportunities,
* Happy PIP Hunting Traders.
*FX KILLA*

US30 4HHey traders, in today's trading session i'm are monitoring US30 for a buying opportunity around 33202 zone, once I will receive any bullish confirmation the trade will be executed.

US30 top-down analysisHello traders, this is a complete multiple timeframe analysis of this pair. We see could find significant trading opportunities as per analysis upon price action confirmation we may take this trade. Smash the like button if you find value in this analysis and drop a comment if you have any questions or let me know which pair to cover in my next analysis.

US30 SHORTCURRENCYCOM:US30
Potential sell setup on US30. Price broke a key support zone, retesting onto the previous support now turned into resistance.

Big drop on DOW Jones/US30Looking at three potential areas to short the market from.
Firstly we have the 4hr distribution that occurred prior to the short term drop in the market.
Then we have a potential short from somewhere in between the FVG of the two daily candles.
Lastly, the 50% of the huge daily wick seen in December could be a top in this market from where we can see new lows being made below the 28700 level.

US30 ANALYSIS so far price has been trending to the upside , will wait for price to come back into our OB at 33000 to look for potential buys ..or wait for price to mitigate our 34000 OB to look for short term sells

US30.....4h= Dow Jones analysis on the four-hour chart
= We have a diamond pattern with a bearish movement..and it has four bearish targets
= Also according to the Dow rules, it is qualified to break the uptrend in blue

Us30 bullish Us30 has been ranging and finally broke above resistance level on the 4h Timeframe. Expecting a further push to the upside⬆️

Us30 bullishUs30 has been ranging on 4h Timeframe and finally broke above resistance level. Expecting a further push to the upside⬆️.
Like, comment and follow my trade setup.


Dow Jones Analysis 25.01.2023Hello Traders,
welcome to this free and educational analysis.
I am going to explain where I think this asset is going to go over the next few days and weeks and where I would look for trading opportunities.
If you have any questions or suggestions which asset I should analyse tomorrow, please leave a comment below.
I will personally reply to every single comment!
If you enjoyed this analysis, I would definitely appreciate it, if you smash that like button and maybe consider following my channel.
Thank you for watching and I will see you tomorrow!
You can also check out my previous analysis of this asset:

US30 Sell setup1:6.9 Risk reward setup on US30
Market broke structure into bearish market
there is and order block wish will be mitigated on the 33700 price level then short
Entry : 33719
stop loss : 33823
take profit : 33000
risk 0.5%

US30(Dow Jones) : Short Trade , 4hUS30 sell Entry : 33781
Stop : 34195 , Target1 : 33366 , Target2 : 32954
Risk/Reward Ratio : 2

DOW JONES (US30) - Short from bearish orderblock ✅Hello traders!
‼️ This is my perspective of US30.
Here I expect price to continue the retracement to fill the imbalance higher. I am looking for a short position if price rejects from bearish orderblock around 33900 price level.
Like, comment and subscribe to be in touch with my content!

YM1! US30USD DOW 2023 JAN 23
YM1! US30USD DOW 2023 JAN 23
Last week, Dow Scenario1 rejection of 34605 short yielded 900pts
(trail stop TP).
With this rejection, DOW now exhibits rotation behavior
34605 - 32789.
Possible scenarios:
1) Rotational play: Trades can be executed at boundary of rotation
range 34605 / 32789.
- Long if supported at 32789
- Short if rejected at 34605
2) Rotational breakout/breakdown:
- If price breakout, long when price retraces and finds support
- If price breakdown, short when price retraces and is rejected
Volume Analysis:
Weekly: Low vol wide spread S>D bar = weakness
Daily: Ave vol up bar close at high = No demand
H4: High vol up bar closed off high = minor weakness
Price reaction levels
Short on Test and Reject | Long on Test and Accept
35750 35228 34416-34605
32789 30513
28635
Remember to like and follow if you find this useful.
Have a profitable week ahead.

US30(Dow Jones) : Short Trade , 1hUS30 sell Entry : 33398
Stop : 33643 , Target1 : 33157 , Target2 : 32907
Risk/Reward Ratio : 2
US30 to find support at previous lows?DOW30 - Intraday - We look to Buy at 32845 (stop at 32645)
Continued downward momentum from 34358 resulted in the pair posting net daily losses yesterday.
The 261.8% Fibonacci extension is located at 32845 from 34358 to 33784.
We have a 78.6% Fibonacci pullback level of 32845 from 32437 to 34347.
Although the anticipated move higher is corrective, it does offer ample risk/reward today.
Our profit targets will be 33370 and 33470
Resistance: 33200 / 33570 / 34034
Support: 32845 / 32812 / 29068
Risk Disclaimer
The trade ideas beyond this page are for informational purposes only and do not constitute investment advice or a solicitation to trade. This information is provided by Signal Centre, a third-party unaffiliated with OANDA, and is intended for general circulation only. OANDA does not guarantee the accuracy of this information and assumes no responsibilities for the information provided by the third party. The information does not take into account the specific investment objectives, financial situation, or particular needs of any particular person. You should take into account your specific investment objectives, financial situation, and particular needs before making a commitment to trade, including seeking advice from an independent financial adviser regarding the suitability of the investment, under a separate engagement, as you deem fit.
You accept that you assume all risks in independently viewing the contents and selecting a chosen strategy.
Where the research is distributed in Singapore to a person who is not an Accredited Investor, Expert Investor or an Institutional Investor, Oanda Asia Pacific Pte Ltd (“OAP“) accepts legal responsibility for the contents of the report to such persons only to the extent required by law. Singapore customers should contact OAP at 6579 8289 for matters arising from, or in connection with, the information/research distributed.

US30 ANALYSISPossible Sell Opportunity at The 4H OB ,PREDICTING a Huge Spike Towards The Upside Before Dropping ...
