US30 Local Short!
HI,Traders !
US30 index is moving in a sideways
movement Over the medium term down
Again and will soon hit
A horizontal support
Of 44482.4 from where
We will be expecting a
Local bullish rebound !
Comment and subscribe to help us grow !
Us30cash

US30 Locked & Loaded – Get In, Get Profit, Get Out!**💰 Market Heist Alert: US30 Setup 🔥**
Yo Money Raiders & Chart Bandits! 🏴☠️📈
US30 is ripe for the taking, and we’re rollin’ in with the *Thief Trading Style*—a slick mix of sniper-level technicals and street-smart fundamentals. Whether it’s bull or bear, we strike fast, grab profit, and vanish! 💨💸
---
**🧠 The Blueprint – US30 Hit Plan**
**📍 Entry Zones:**
🔹 **Bullish Strike 1**: Look for a pullback and **buy at 42400** – clean signal to enter the action!
🔹 **Bullish Strike 2**: Set your sights on **40900 - 40800**, inside the Institutional Buy Zone. Wait for an MA pullback, then hit it hard. Fortune favors the bold! ⚔️
🔹 **Bearish Ambush**: If price breaks down below **41600**, it’s time to ride that bear wave 🐻💨
💡 **Pro Bandit Tip**: Set alerts on key levels so you never miss the moment! 🔔
---
**🛑 Stop Loss Defense:**
Protect the stash! Use the **nearest 4H low** as your SL for day/swing trades.
Tweak based on your risk level, lot size, and open positions. 🛡️
---
**🎯 Profit Targets – Take the Loot:**
💥 **Bullish Goal**: Lock in at **44200** – or escape early if momentum cools 😎
💥 **Bearish Goal**: Target **40600** – but don’t overstay if signs reverse 🚪
🚨 Watch out for overbought/oversold traps – this is where many fall.
---
**⚠️ Risk Alert – News Incoming!**
News events = wild moves. Handle with care:
📰 Avoid new entries during major news drops
📉 Use **trailing SL** to secure profits and manage risk like a pro
Stay smart. Stay ready. This is a heist, not a gamble! 💼💣
---
**🚀 Boost the Thief Trading Movement!**
If this setup hits your style, smash that **boost** and show love to the Thief Crew! 💪
We raid charts daily with precision, profit, and a bit of outlaw swagger. Let’s own the US30 together! 🤝💵
Stay sharp, alerts on, and eyes wide—more setups coming soon.
Catch you in the green, bandits! 🤑🎉📊

"US30 Heist Alert: Thief Style's Bullish Plan to Steal Profits!"🌟 Salut! Ciao! Hola! Konnichiwa! 🌟
Dear Wealth Raiders & Market Bandits, 🤑💰✈️
Here’s our slick *Thief Trading Style* heist plan for the **US30 / Dow Jones Industrial Average Cash** Index, crafted with sharp technicals and fundamentals. 💥 Stick to the chart’s long entry strategy and aim to slip out near the spicy Yellow ATR Zone—a risky, overbought level where bears and traps lurk. 🏆💸 *Grab profits and treat yourself, you’ve earned it!* 💪🎉
**Entry 📈**: The heist kicks off! Watch for a breakout above the MA line (42600.0) to jump in—bullish riches await! 🤑 Set *buy stop orders* above the MA or *buy limit orders* near the most recent 15/30-min swing low/high for pullback entries. 🚨 Set an *alert* to catch the breakout signal!
**Stop Loss 🛑**: Yo, thieves, listen up! 🗣️ For buy stop orders, hold off on placing that stop loss until the breakout confirms. 🔊 Place it at the 8H recent/swing low (40850.0) for day/swing trades. Adjust SL based on your risk, lot size, and number of orders. Play it smart, or it’s your loot on the line! ⚠️🔥
**Target 🎯**: Aim for 44500.0 or bail before the target hits. 🏴☠️
**Scalpers, eyes here 👀**: Stick to long-side scalps. Big bankrolls can dive in; smaller ones, join the swing trade heist. Use *trailing SL* to lock in your haul. 💰
💸 **US30 Market Heist Outlook**: The index is neutral but leaning bullish, fueled by key drivers. ☝ Check the fundamentals, macroeconomics, COT reports, geopolitics, sentiment, intermarket analysis, and future trend targets for the full score. 🌎🔗
⚠️ **Trading Alert: News & Position Management** 📰🚫
News can shake the market hard. To protect your loot:
- Skip new trades during news releases.
- Use trailing stop-loss orders to secure running profits.
💖 Boost our heist plan! 🚀 Hit that *Boost Button* to power up our robbery squad. With *Thief Trading Style*, we’re snatching profits daily. 🏆🤝 Stay sharp for the next heist plan! 🤑🐱👤🤩
---
### Latest Real-Time Data (UTC+1, May 16, 2025) 📊
*Data sourced from reliable platforms like Financial Juice and official market feeds.*
**Indices** 📈
- US30 (Dow Jones): 42580.0 | +0.18% 😊
- S&P 500: 5720.5 | +0.12% 😄
- NASDAQ 100: 20150.2 | +0.25% 😊
- FTSE 100: 8250.3 | -0.05% 😐
---
### Latest COT Data (Updated Friday, May 9, 2025) 📑
*Commitment of Traders (COT) report for US30/Dow Jones futures, sourced from CFTC.*
- **Non-Commercial (Speculators)**:
- Long: 45,200 contracts | +2,500 😄
- Short: 38,900 contracts | -1,200 😊
- Net Position: +6,300 (Bullish bias) 🟢
- **Commercial (Hedgers)**:
- Long: 82,500 contracts | -1,000 😐
- Short: 90,700 contracts | +800 😐
- Net Position: -8,200 (Bearish hedge) 🔴
- **Open Interest**: 165,400 contracts | +1,200 😊
- **Key Insight**: Speculators are increasing bullish bets, while hedgers lean bearish, signaling potential volatility near resistance levels like the Yellow ATR Zone. ⚠️
---
💥 Join the *Thief Trading* crew, boost the plan, and let’s raid the markets together! 🤑🚀

US30/DJI "Dow Jones" Index CFD Market Heist Plan (Day or Swing)🌟Hi! Hola! Ola! Bonjour! Hallo! Marhaba!🌟
Dear Money Makers & Robbers, 🤑💰✈️
Based on 🔥Thief Trading style technical and fundamental analysis🔥, here is our master plan to heist the US30/DJI "Dow Jones" Index CFD Market. Please adhere to the strategy I've outlined in the chart, which emphasizes short entry. Our aim is the high-risk Yellow MA Zone. Risky level, oversold market, consolidation, trend reversal, trap at the level where traders and bullish robbers are stronger. 🏆💸"Take profit and treat yourself, traders. You deserve it!💪🏆🎉
Entry 📈 : "The vault is wide open! Swipe the Bearish loot at any price - the heist is on!
however I advise to Place sell limit orders within a 15 or 30 minute timeframe most nearest or swing, low or high level for Pullback Entries.
Stop Loss 🛑:
📌Thief SL placed at the nearest/swing High or Low level Using the 1D timeframe (41000) Day/Swing trade basis.
📌SL is based on your risk of the trade, lot size and how many multiple orders you have to take.
Target 🎯: 35000 (or) Escape Before the Target
💰💵💸US30/DJI "Dow Jones" Index CFD Market Heist Plan (Swing/Day Trade) is currently experiencing a Bearish trend.., driven by several key factors.👇👇👇
📰🗞️Get & Read the Fundamental, Macro, COT Report, Geopolitical and News Analysis, Sentimental Outlook, Intermarket Analysis, Index-Specific Analysis, Future trend targets with Overall outlook score... go ahead to check 👉👉👉🔗🔗
⚠️Trading Alert : News Releases and Position Management 📰 🗞️ 🚫🚏
As a reminder, news releases can have a significant impact on market prices and volatility. To minimize potential losses and protect your running positions,
we recommend the following:
Avoid taking new trades during news releases
Use trailing stop-loss orders to protect your running positions and lock in profits
💖Supporting our robbery plan 💥Hit the Boost Button💥 will enable us to effortlessly make and steal money 💰💵. Boost the strength of our robbery team. Every day in this market make money with ease by using the Thief Trading Style.🏆💪🤝❤️🎉🚀
I'll see you soon with another heist plan, so stay tuned 🤑🐱👤🤗🤩

"US30/DJI30" Index CFD Market Heist Plan (Scalping/Day Trade)🌟Hi! Hola! Ola! Bonjour! Hallo! Marhaba!🌟
Dear Money Makers & Robbers, 🤑 💰💸✈️
Based on 🔥Thief Trading style technical and fundamental analysis🔥, here is our master plan to heist the "US30/DJI30" Index CFD Market. Please adhere to the strategy I've outlined in the chart, which emphasizes long entry. Our aim is to escape near the high-risk MA Zone. Risky level, overbought market, consolidation, trend reversal, trap at the level where traders and bearish robbers are stronger. 🏆💸"Take profit and treat yourself, traders. You deserve it!💪🏆🎉
Entry 📈 : "The heist is on! Wait for the MA breakout (40800) then make your move - Bullish profits await!"
however I advise to Place Buy stop orders above the Moving average (or) Place buy limit orders within a 15 or 30 minute timeframe most recent or swing, low or high level for Pullback entries.
📌I strongly advise you to set an "alert (Alarm)" on your chart so you can see when the breakout entry occurs.
Stop Loss 🛑: "🔊 Yo, listen up! 🗣️ If you're lookin' to get in on a buy stop order, don't even think about settin' that stop loss till after the breakout 🚀. You feel me? Now, if you're smart, you'll place that stop loss where I told you to 📍, but if you're a rebel, you can put it wherever you like 🤪 - just don't say I didn't warn you ⚠️. You're playin' with fire 🔥, and it's your risk, not mine 👊."
📍 Thief SL placed at the recent/swing low level Using the 1H timeframe (39200) Day trade basis.
📍 SL is based on your risk of the trade, lot size and how many multiple orders you have to take.
🏴☠️Target 🎯: 42700 (or) Escape Before the Target
🧲Scalpers, take note 👀 : only scalp on the Long side. If you have a lot of money, you can go straight away; if not, you can join swing traders and carry out the robbery plan. Use trailing SL to safeguard your money 💰.
💰💵💴💸"US30/DJI30" Index CFD Market Heist Plan (Day / Scalping Trade) is currently experiencing a bullishness🐂.., driven by several key factors.👇👇👇
📰🗞️Get & Read the Fundamental, Macro, COT Report, Quantitative Analysis, Sentimental Outlook, Intermarket Analysis, Future trend targets... go ahead to check 👉👉👉🔗🔗
⚠️Trading Alert : News Releases and Position Management 📰 🗞️ 🚫🚏
As a reminder, news releases can have a significant impact on market prices and volatility. To minimize potential losses and protect your running positions,
we recommend the following:
Avoid taking new trades during news releases
Use trailing stop-loss orders to protect your running positions and lock in profits
💖Supporting our robbery plan 💥Hit the Boost Button💥 will enable us to effortlessly make and steal money 💰💵. Boost the strength of our robbery team. Every day in this market make money with ease by using the Thief Trading Style.🏆💪🤝❤️🎉🚀
I'll see you soon with another heist plan, so stay tuned 🤑🐱👤🤗🤩

"US30/DJ30" Index CFD Market Heist Plan (Scalping/Day Trade)🌟Hi! Hola! Ola! Bonjour! Hallo! Marhaba!🌟
Dear Money Makers & Robbers, 🤑💰✈️
Based on 🔥Thief Trading style technical and fundamental analysis🔥, here is our master plan to heist the "US30/DJ30" Index CFD Market. Please adhere to the strategy I've outlined in the chart, which emphasizes short entry. Our aim is the high-risk Green Zone. Risky level, oversold market, consolidation, trend reversal, trap at the level where traders and bullish robbers are stronger. 🏆💸Book Profits Be wealthy and safe trade.💪🏆🎉
Entry 📈 : "The vault is wide open! Swipe the Bearish loot at any price - the heist is on!
however I advise to Place sell limit orders within a 15 or 30 minute timeframe most nearest or swing, low or high level.
Stop Loss 🛑: (42200) Thief SL placed at the nearest / swing high level Using the 3H timeframe scalping / day trade basis.
SL is based on your risk of the trade, lot size and how many multiple orders you have to take.
Target 🎯: 40200
🧲Scalpers, take note 👀 : only scalp on the Short side. If you have a lot of money, you can go straight away; if not, you can join swing traders and carry out the robbery plan. Use trailing SL to safeguard your money 💰.
"US30/DJ30" Index CFD Market Heist Plan (Scalping/Day Trade) is currently experiencing a bearishness,., driven by several key factors.
📰🗞️Get & Read the Fundamental, Macro Economics, COT Report, Geopolitical and News Analysis, Sentimental Outlook, Intermarket Analysis, Index-Specific Analysis, Positioning and future trend targets... go ahead to check 👉👉👉🔗
⚠️Trading Alert : News Releases and Position Management 📰 🗞️ 🚫🚏
As a reminder, news releases can have a significant impact on market prices and volatility. To minimize potential losses and protect your running positions,
we recommend the following:
Avoid taking new trades during news releases
Use trailing stop-loss orders to protect your running positions and lock in profits
💖Supporting our robbery plan 💥Hit the Boost Button💥 will enable us to effortlessly make and steal money 💰💵. Boost the strength of our robbery team. Every day in this market make money with ease by using the Thief Trading Style.🏆💪🤝❤️🎉🚀
I'll see you soon with another heist plan, so stay tuned 🤑🐱👤🤗🤩

US30/DJI "Dow Jones" Index CFD Market Heist Plan (Day or Swing)🌟Hi! Hola! Ola! Bonjour! Hallo! Marhaba!🌟
Dear Money Makers & Robbers, 🤑 💰💸✈️
Based on 🔥Thief Trading style technical and fundamental analysis🔥, here is our master plan to heist the US30/DJI "Dow Jones" Index CFD Market. Please adhere to the strategy I've outlined in the chart, which emphasizes long entry. Our aim is the high-risk Red Zone. Risky level, overbought market, consolidation, trend reversal, trap at the level where traders and bearish robbers are stronger. 🏆💸Book Profits Be wealthy and safe trade.💪🏆🎉
Entry 📈 : "The heist is on! Wait for the MA breakout (42200) then make your move - Bullish profits await!"
however I advise to Place Buy stop orders above the Moving average (or) Place buy limit orders within a 15 or 30 minute timeframe most recent or swing, low or high level.
📌I strongly advise you to set an alert on your chart so you can see when the breakout entry occurs.
Stop Loss 🛑:
Thief SL placed at the recent/swing low level Using the 1H timeframe (41400) swing trade basis.
SL is based on your risk of the trade, lot size and how many multiple orders you have to take.
🏴☠️Target 🎯: 43100 (or) Escape Before the Target
🧲Scalpers, take note 👀 : only scalp on the Long side. If you have a lot of money, you can go straight away; if not, you can join swing traders and carry out the robbery plan. Use trailing SL to safeguard your money 💰.
US30/DJI "Dow Jones" Index CFD Market Heist Plan (Swing/Day) is currently experiencing a bullishness,., driven by several key factors.
📰🗞️Get & Read the Fundamental, Macro, COT Report, Geopolitical and News Analysis, Sentimental Outlook, Intermarket Analysis, Index-Specific Analysis, Positioning and future trend targets.. go ahead to check 👉👉👉
📌Keep in mind that these factors can change rapidly, and it's essential to stay up-to-date with market developments and adjust your analysis accordingly.
⚠️Trading Alert : News Releases and Position Management 📰 🗞️ 🚫🚏
As a reminder, news releases can have a significant impact on market prices and volatility. To minimize potential losses and protect your running positions,
we recommend the following:
Avoid taking new trades during news releases
Use trailing stop-loss orders to protect your running positions and lock in profits
💖Supporting our robbery plan 💥Hit the Boost Button💥 will enable us to effortlessly make and steal money 💰💵. Boost the strength of our robbery team. Every day in this market make money with ease by using the Thief Trading Style.🏆💪🤝❤️🎉🚀
I'll see you soon with another heist plan, so stay tuned 🤑🐱👤🤗🤩

"US30/DJ30" Indices Heist Plan (Scalping / Day Trade)🌟Hi! Hola! Ola! Bonjour! Hallo! Marhaba!🌟
Dear Money Makers & Robbers, 🤑 💰💸✈️
Based on 🔥Thief Trading style technical and fundamental analysis🔥, here is our master plan to heist the US30/DJ30 Index CFD Market. Please adhere to the strategy I've outlined in the chart, which emphasizes long entry. Our aim is the high-risk Red Zone. Risky level, overbought market, consolidation, trend reversal, trap at the level where traders and bearish robbers are stronger. 🏆💸"Take profit and treat yourself, traders. You deserve it!💪🏆🎉
Entry 📈 : "The vault is wide open! Swipe the Bullish loot at any price - the heist is on!
however I advise to Place buy limit orders within a 15 or 30 minute timeframe most recent or swing, low or high level. I Highly recommended you to put alert in your chart.
Stop Loss 🛑:
Thief SL placed at the recent/swing low level Using the 30m timeframe (42000) swing trade basis.
SL is based on your risk of the trade, lot size and how many multiple orders you have to take.
🏴☠️Target 🎯: 42630 (or) Escape Before the Target
🧲Scalpers, take note 👀 : only scalp on the Long side. If you have a lot of money, you can go straight away; if not, you can join swing traders and carry out the robbery plan. Use trailing SL to safeguard your money 💰.
"US30/DJ30" Index CFD Market Heist Plan (Scalping / Day Trade) is currently experiencing a bullishness,., driven by several key factors.
📰🗞️Get & Read the Fundamental, Macro, COT Report, Geopolitical and News Analysis, Sentimental Outlook, Intermarket Analysis, Index-Specific Analysis, Positioning and future trend targets.. go ahead to check 👉👉👉
📌Keep in mind that these factors can change rapidly, and it's essential to stay up-to-date with market developments and adjust your analysis accordingly.
⚠️Trading Alert : News Releases and Position Management 📰 🗞️ 🚫🚏
As a reminder, news releases can have a significant impact on market prices and volatility. To minimize potential losses and protect your running positions,
we recommend the following:
Avoid taking new trades during news releases
Use trailing stop-loss orders to protect your running positions and lock in profits
💖Supporting our robbery plan 💥Hit the Boost Button💥 will enable us to effortlessly make and steal money 💰💵. Boost the strength of our robbery team. Every day in this market make money with ease by using the Thief Trading Style.🏆💪🤝❤️🎉🚀
I'll see you soon with another heist plan, so stay tuned 🤑🐱👤🤗🤩

"US30 / DJI" Indices Market Bearish Heist Plan🌟Hi! Hola! Ola! Bonjour! Hallo!🌟
Dear Money Makers & Robbers, 🤑 💰🐱👤🐱🏍
Based on 🔥Thief Trading style technical and fundamental analysis🔥, here is our master plan to heist the "US30 / DJI" Indices Market. Please adhere to the strategy I've outlined in the chart, which emphasizes short entry. Our aim is the high-risk Green Zone. Risky level, oversold market, consolidation, trend reversal, trap at the level where traders and bullish thieves are getting stronger. 🏆💸Book Profits Be wealthy and safe trade.💪🏆🎉
Entry 📈 : "The vault is wide open! Swipe the Bearish loot at any price - the heist is on!
however I advise placing Sell limit orders within a 15 or 30 minute timeframe. Entry from the most recent or closest low or high level should be in retest.
Stop Loss 🛑: Thief SL placed at (44200) swing Trade Basis Using the 4H period, the recent / swing high or low level.
SL is based on your risk of the trade, lot size and how many multiple orders you have to take.
Target 🎯: 42200 (or) Escape Before the Target
🧲Scalpers, take note 👀 : only scalp on the Short side. If you have a lot of money, you can go straight away; if not, you can join swing traders and carry out the robbery plan. Use trailing SL to safeguard your money 💰.
📰🗞️Fundamental, Macro, COT, Sentimental Outlook:
"US30 / DJI" Indices Market is currently experiencing a Bearish trend., driven by several key factors.
🟣Fundamental Analysis
Earnings: Q4 2024 EPS growth strong (e.g., 16.9% for S&P 500 proxies)—bullish, but US30 firms face tariff uncertainty.
Rates: Fed at 3-3.5%, no cuts signaled—real yields ~1% (10-year Treasury 3.8%) pressure equities—bearish.
Inflation: PCE 2.6% (Jan 2025)—persistent inflation supports Fed stance, bearish for stocks.
Growth: U.S. consumer spending wanes (Schwab)—mixed, neutral impact.
Geopolitics: Trump tariffs (25% Mexico/Canada, 10% China)—short-term volatility, long-term bullish for U.S. firms.
🟤Macro Economics
Federal Reserve Policy: The Federal Reserve has been raising interest rates to combat inflation, which has led to a strengthening of the US dollar.
US Economy: The US economy has been showing signs of slowing down, with GDP growth rates decreasing.
Global Economy: The global economy has been experiencing a slowdown, with many countries experiencing recession.
⚪Commitments of Traders (COT) Data
Speculators: Net long ~55,000 contracts (down from 65,000)—cooling bullishness.
Hedgers: Net short ~60,000—stable, locking in gains.
Open Interest: ~125,000 contracts—steady global interest, neutral.
🔴Market Sentimental Analysis
Bullish Sentiment: Some analysts believe that the US30 will break above the resistance at 45,000 and continue rising.
Bearish Sentiment: Many investors expect a correction, with a potential target of 42200.
Risk Aversion: The market is experiencing risk aversion, with investors seeking safe-haven assets.
🔵Positioning Analysis
Long Positions: Some investors are holding long positions in US30, expecting a breakout above 45,000.
Short Positions: Many investors are holding short positions in US30, expecting a correction.
🟠Quantitative Analysis
Technical Indicators: The 14-day Relative Strength Index (RSI) is at 45, indicating a neutral sentiment.
Moving Averages: The 21-day Simple Moving Average (SMA) is at 44,404, providing resistance for US30 prices.
🟡Intermarket Analysis
DXY: 106.00—USD softness aids equities—bullish.
XAU/USD: 2910—gold rise signals risk-off, bearish for US30.
NDX: ~20,000, tech softening—correlated pressure on US30—bearish.
Bonds: U.S. 10-year 3.8%—yield stability neutral.
🟢News and Events Analysis
Federal Reserve Meeting: The Federal Reserve is scheduled to meet on March 15-16, with investors expecting a potential rate hike.
US Economic Data: The US economic data, including the Non-Farm Payrolls report, is being closely watched for its impact on US30 prices.
🟣Next Trend Move
Bullish Trend: Some analysts believe that the US30 will break above the resistance at 45,000 and continue rising.
Bearish Trend: Many investors expect a correction, with a potential target of 42,200.
🔴Overall Summary Outlook
Bullish Outlook: Some analysts believe that the US30 will break above the resistance at 45,000 and continue rising.
Bearish Outlook: Many investors expect a correction, with a potential target of 42,200.
📌Keep in mind that these factors can change rapidly, and it's essential to stay up-to-date with market developments and adjust your analysis accordingly.
⚠️Trading Alert : News Releases and Position Management 📰 🗞️ 🚫🚏
As a reminder, news releases can have a significant impact on market prices and volatility. To minimize potential losses and protect your running positions,
we recommend the following:
Avoid taking new trades during news releases
Use trailing stop-loss orders to protect your running positions and lock in profits
💖Supporting our robbery plan 💥Hit the Boost Button💥 will enable us to effortlessly make and steal money 💰💵. Boost the strength of our robbery team. Every day in this market make money with ease by using the Thief Trading Style.🏆💪🤝❤️🎉🚀
I'll see you soon with another heist plan, so stay tuned 🤑🐱👤🤗🤩

"US30 / DJI 30" Indices Market Bullish Heist Plan🌟Hi! Hola! Ola! Bonjour! Hallo!🌟
Dear Money Makers & Robbers, 🤑 💰
Based on 🔥Thief Trading style technical analysis🔥, here is our master plan to heist the "US30 / DJI 30" Indices market. Please adhere to the strategy I've outlined in the chart, which emphasizes long entry. Our aim is the high-risk Red Zone. Risky level, overbought market, consolidation, trend reversal, trap at the level where traders and bearish robbers are stronger. 👀 So Be Careful, wealthy and safe trade.💪🏆🎉
Entry 📈 : You can enter a Bull trade at any point,
however I advise placing Buy limit orders within a 15 or 30 minute timeframe. Entry from the most recent or closest low or high level should be in retest.
Stop Loss 🛑: Using the 2H period, the recent / nearest low or high level.
Goal 🎯: 44,200.00
Scalpers, take note : only scalp on the Short side. If you have a lot of money, you can go straight away; if not, you can join swing traders and carry out the robbery plan. Use trailing SL to safeguard your money 💰.
Warning⚠️ : Our heist strategy is incompatible with Fundamental Analysis news 📰 🗞️. We'll wreck our plan by smashing the Stop Loss 🚫🚏. Avoid entering the market right after the news release.
Take advantage of the target and get away 🎯 Swing Traders Please reserve the half amount of money and watch for the next dynamic level or order block breakout. Once it is resolved, we can go on to the next new target in our heist plan.
💖Supporting our robbery plan will enable us to effortlessly make and steal money 💰💵 Tell your friends, Colleagues and family to follow, like, and share. Boost the strength of our robbery team. Every day in this market make money with ease by using the Thief Trading Style.🏆💪🤝❤️🎉🚀
I'll see you soon with another heist plan, so stay tuned 🫂

US30 2024/04/10Still within 15 min Bearish range
POI's Marked out for CPI, wil be looking for MSS on said POI's, also trendline liq forming above price anticipating it to be run at some point

US30 Wave Structure BreakdownI have broken down the entire wave structure of the upward impulse which started in October 2022 up to today.
The chart is self explanatory and consist of my main wave count of US30 Index. Right now we are starting our Wave C of corrective cycle which is expected to bottom in the given range but the outlook can change depending on the upcoming news.

Took a couple of trades this week. Tell me how i did..Lost out on one because of a slight calculation error but every mistake is a gift to be learned. Getting closer to the be all end all strategy ( maybe im delusional, or maybe im o the right track. Used a trend/percentage changes that happens every 3 months to get my fib figures. I only take trades that have one directional bias that last 24hours. Comment your thoughts down below. LETS KILL THE DJ30 tomorrow🤞✔.

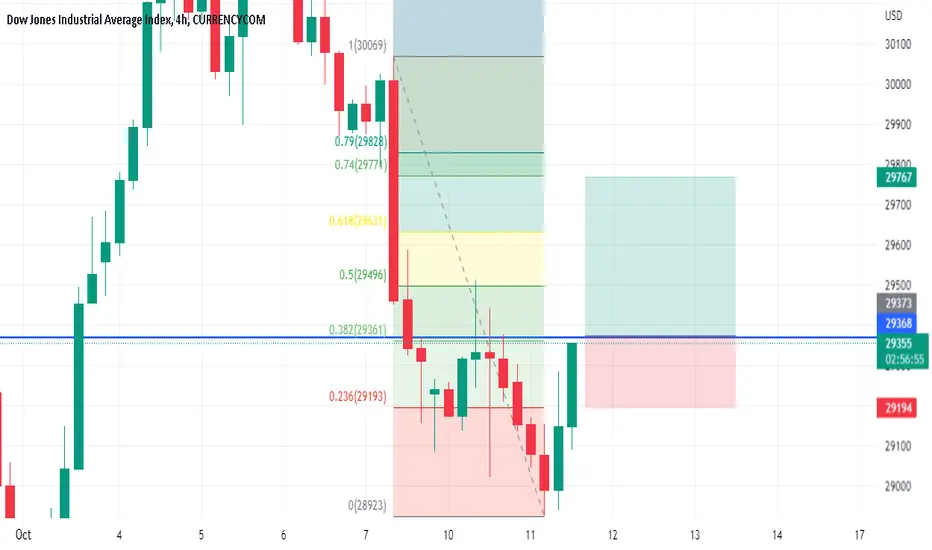
Potential reversal for us30 Read the description.a double bottom on 4H time frame with oversold indicators and breaking up it will be interesting when broking the 38% of Fib retracement to continue up tp1 50% of Fib, tp2 61.8% and the Full target at 74%.
US30 Multi timeframe analysisHello traders, this is the full breakdown of this pair. We will take this trade if all the conditions are satisfied as discussed in the analysis. Smash the like button if you find value in this analysis and drop a comment if you have any questions or let me know which pair to cover in my next analysis.
Press like button if you enjoy this content 😊

double bottom formed on 1h time frame for a reversalbreaking the resistance up will be interesting for a buy


DowJones short H4 DJ30 US30CashContinuation of my previous trade. Where DJ is trending downwards congesting the support area.
Why I entered a short position? Because of the breakout of previous support. Fundamentals are gearing towards bearish due to fear in the Dollar market.
Tranche Targets @ 1:1, 1:2 and 1:3.

DowJone SHORT H4The fundamentals are leaning towards a bearish DJ30. I have seen a trend line that is slowly creating a pennant. Went conservative with my Stop Loss and will exit the market once the price invalidates my set up as well as the trend line.

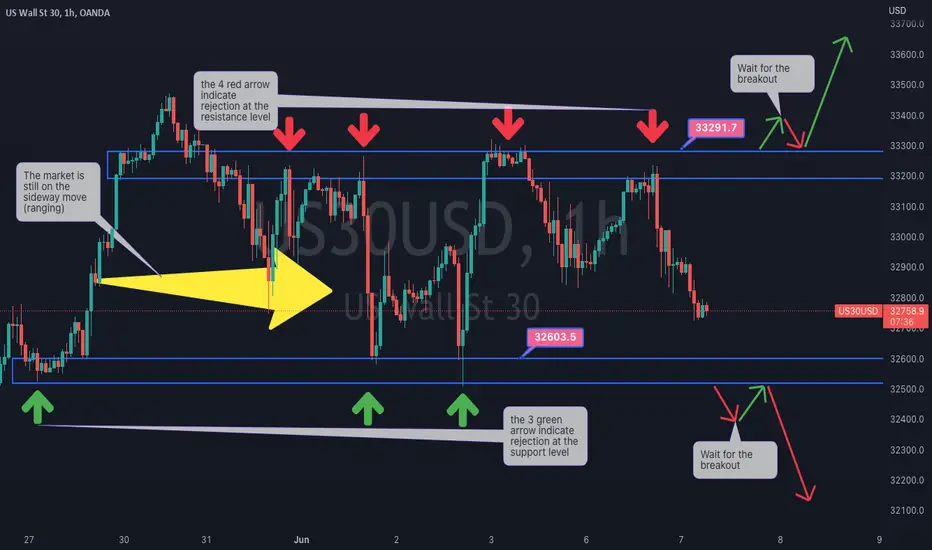
US 30 on H1 chart daily updateThe market is still on the range. We are seeing a build up for a breakout in the market , at this moment one should wait for the breakout. The level that I'm looking for the breakout are 33326.9 from the resistance or 32614.3 from the support level.

US 30 on the H1 chart updateThe market is still moving sideways at this moment. Let us hope you are planning your trade wisely as we know that if you do not have strategy for ranging market you will be playing with fire. As for me I'm waiting for the breakout before I can take any trade.
US 30 on the H4 chart The price is is currently on the support level. The are 2 possibilities that my take place at the level 1. we may see the price pushing to the upside aiming to reach the resistance or 2. the price may break it and push to the down side as we know that the market is still under the control of the bears.

US 30 H1 chart The US 30 on H1 chart. The movements of the past 4 days. Please follow my another days to see the full analysis.
