US 30 daily analysisMy daily analysis on US 30 on H1 chart. The price is currently on a triangle. One will need to wait for the breakout before acting in it.
Us30index

US 30 daily analysis My daily analysis on US 30 on H1 chart. The price is currently moving sideways. we need a Clare move to know if we have a buy or sell.

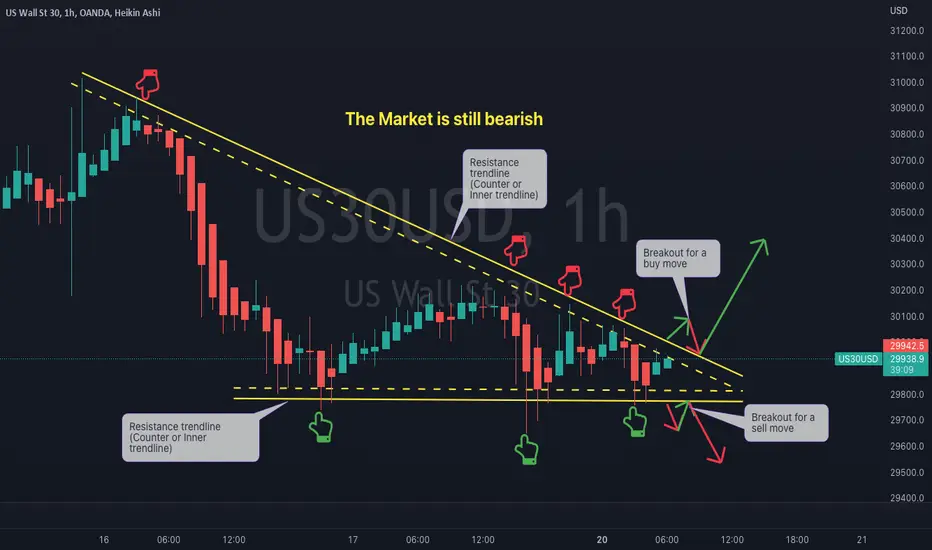
US 30 daily analysis My daily analysis on US 30 on H1 chart. The market is still bearish. The price is currently moving sideways. we need to wait for a breakout before we can take action.

US 30 weekly analysis.My weekly analysis on US 30 on daily chart. Market direction is bearish. The price is making a move towards the resistance level. once is to wait for the reaction at the resistance if the price will breakout or reject before taking a trade.

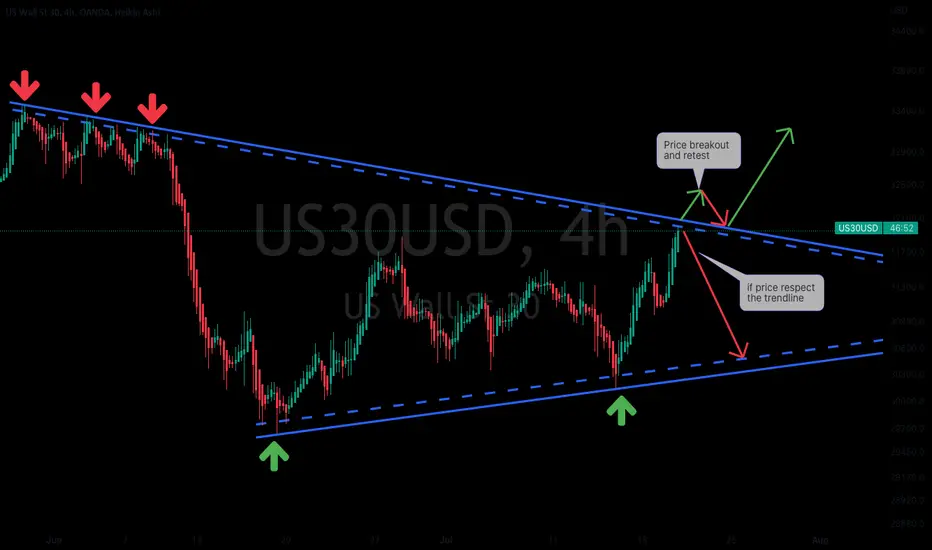
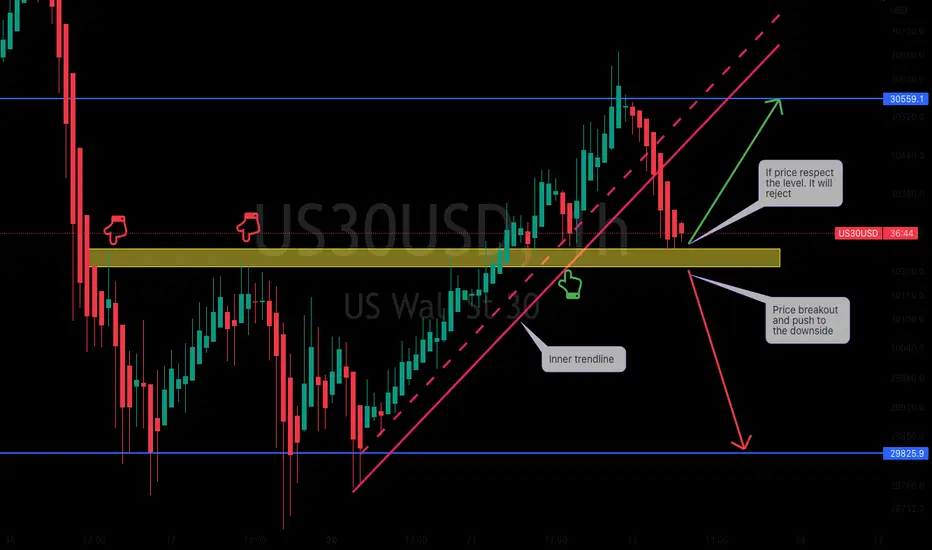
US 30 daily analysisMy daily analysis on US 30. Looking at H1 chart. The price will either push to the up and break the trendline or it will move back down. Let us wait for a breakout on one of the two sides.

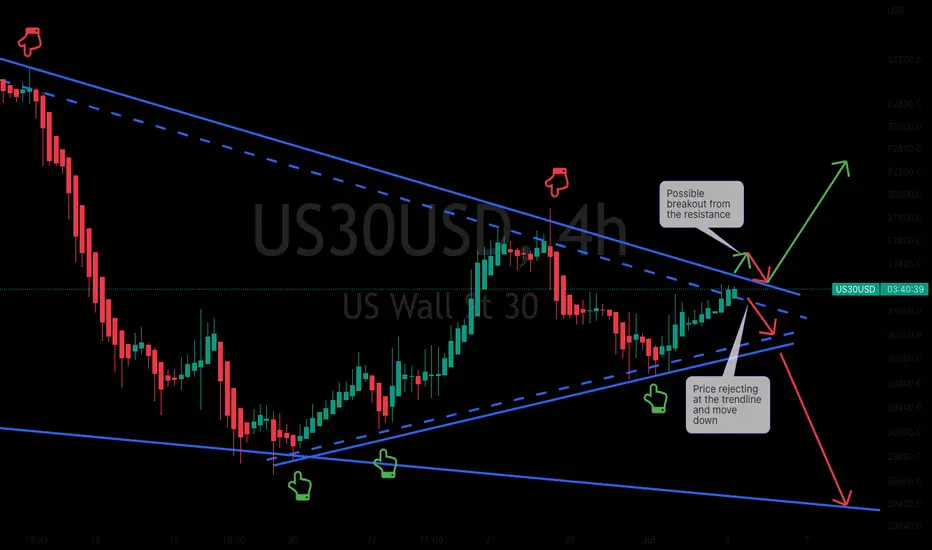
US 30 on H4 chart My daily analysis on US 30 on H4 chart. The price is at the resistance trendline. Two things that may take place at this level. 1) the price can reject and move down or 2) we will see a breakout.
US30 ShortI will be watching for this to happen on US30. Once we approach into the zone i will be looking for either 15min RSI Divergence or SMT Divergence to occur with SPX500. Those are my only entry criteria.

US 30 daily analysis.My daily analysis on H1 chart. The market is still bearish. If the price can retest the level 31321.4, we will see a strong sell off.

US 30 Daily Chart My analysis on daily chart. The market is still bearish. all the analysis are done within a down channel.
US 30 daily analysis on H1 chart.This is my daily analysis on US 30 on H1 chart. The market is still bearish and we're currently on a channel that is moving down. one can wait for a breakout before taking any trade.

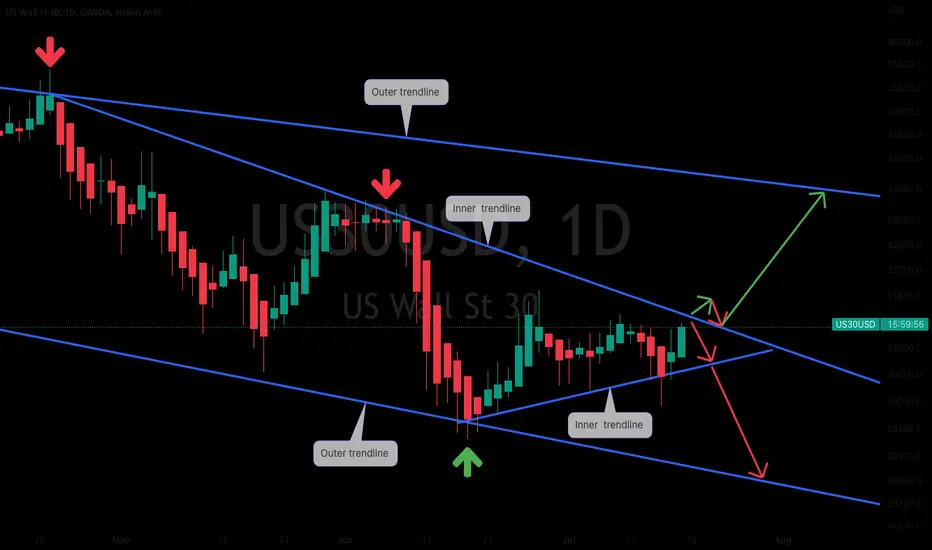
US 30 weekly analysisThis is my weekly analysis for the week to come. The market is still on the down trend. if the reject at the inner trendline we will a strong move to the down. but if it breakout. out target will be the outer trendline.

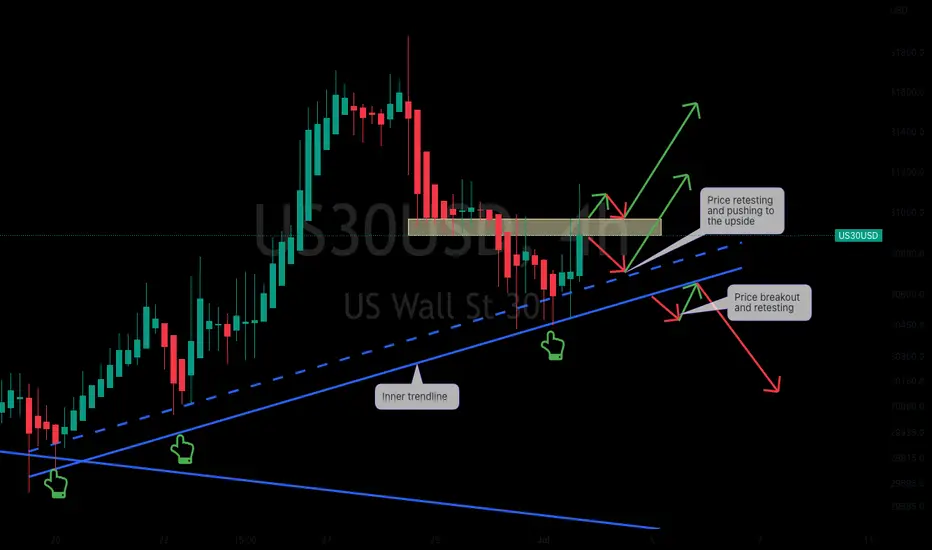
US 30 daily analysisMy daily analysis on US 30. The inner trendline at the resistance level was broken and the price has push to level 31430.1, which the now a current resistance. The price may move down to retest level 31201.1 level and it reject, we will see the price pushing up or the price will move further down if the level does not hold.

US 30 on H1 chart This is my daily analysis on H1 chart. The market is still bearish. The move that we see now is taking place inside a down channel. if you are planning to buy let it be a short one.

US 30 daily analysis My US 30 daily analysis on H4. The price is currently on at the resistance level. If the price, push to the up, we will see a breakout, but if the bears hold the position. The price will reject and move down. Let us remember that we're still under the bear market at this moment.
US 30 weekly analysis on daily chartThe market is still bearish. The price have just rejected at the support level as the price pushing up.
US 30 daily analysisThe US 30 daily analysis. The market is still under bears. we still have high possibility to see the market pushing more down.

US 30 Dow Jones. Weekly Analysis for 27-01/07/22My weekly analysis for US 30. The market is pushing towards the resistance trendline. If the price breakout of the trendline, we will see the market change the direction. If not the price will still move down as we're still in the bear market. I hope you find value in my analysis. Enjoy.

US30| Bears exhausted to push price lower. Expect reversal!Hello traders,
Let's examine the technical aspect of US30. In the beginning of June, we saw US30 dropping hard and eventually broke below the May 2022 low. Instead of bears keeping the momentum to the downside, the market corrected for about two weeks. Looking at the correction there are some details I spotted that may signal bears exhaustion. The market printed a lower low, another lower low and after that bears couldn't be able to push price lower, instead the market created a lower high which of course tells that bears lack sufficient strength to keep up with the momentum. This correction is a typical inverse head and shoulders pattern. I expect the market to rally to the upside with goal of 33000.
Please support this idea with likes. If you have any suggestion or question feel free to share this in the comment section below.

US 30 on H1 chartUS 30 on H1 chart. This is my daily analysis. The price is currently challenge the resistance, if the bulls win we are to see a breakout but if bears are still strong at that level we will see the price moving down.

US 30 my daily analysisMy US 30 daily analysis on H1 chart. The Dow Jones is still a bearish market, Possibilities of it to push further down are high. If you are planning to take a buy be careful because we are still to get a structure for a bullish move.
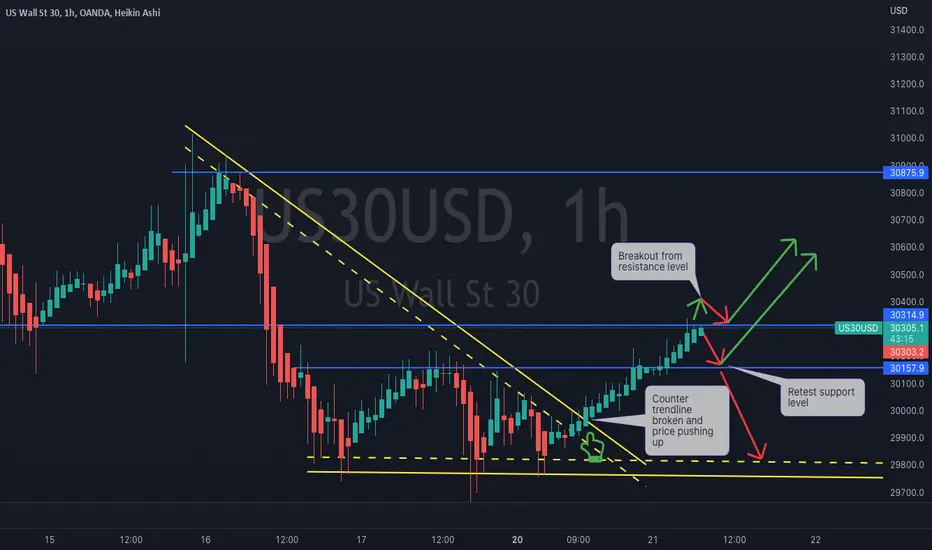
US 30 my daily analysis My daily analysis for US 30 on H1 chart. The price has breakout of the counter trendline and push to the upside. One should get a clear structure before saying we're on a buy and we need to break the high at level 30875 and get a higher high.
US 30 on H1 chart Us 30 on the H1 chart. My analysis for the day. The market is still bearish. If the price is breaking to the upside let us wait for the retest before we can take a buy, as we know that the market is still bearish.
Dow Jones US30 Idea H4Here is my view for US30 on H4. The price could go down, you can put a pending order on the Order block or find an entry on LTF within OB Zone. Trade Safe!
