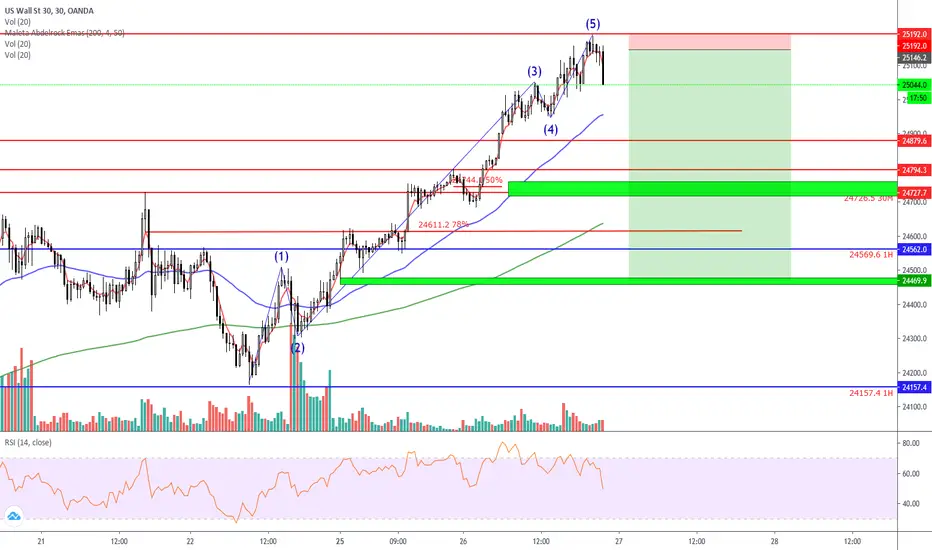
US30 trade idea... Update! +493 pips!Congrats to those that held the trade from yesterday!
Bravo!
Drop me a COMMENT/LIKE AND SUBSCRIBE if you like what I'm doing here: getting people to learn and earn!
Us30index

Looking for a nice long trade on US30Looking for the bullish momentum to continue once we can get some more orders flowing in the market.
We need more suckers to push the market to a more attractive discount level and then we can buy it back and then sell it back to them at a MUCH higher price. HEHE
#us30 #ikoncinvst #us30long
“Buy when everyone else is selling and hold until everyone else is buying. That’s not just a catchy slogan. It’s the very essence of successful investing.”
-J. Paul Getty

US30 TRADING IDEA DAILY - DOW JONES INDUSTRIAL AVERAGE DOWJONESUS30 TRADING IDEA DAILY - DOW JONES INDUSTRIAL AVERAGE DOWJONES

US30 Moving back into CHANNEL 4H DOWJONES INDUSTRIAL INDEX DOWUS30 Moving back into CHANNEL 4H DOWJONES INDUSTRIAL INDEX DOW

US30 H4. Price Action Theory.US30 H4. Price Action Theory.
we have to target(resistance) @28816.62 & @29044.07
I Request to All Before The Trade You Also Match You're Analysis With As If You're Set up Match Then You Can Trade.
Thanks
Regard
Harshilfx Technical Team
Note- Please Take Only 2% Risk On Given Analysis

US30 H4. This Analysis Based On Price Action Theory.We Have an Analysis Of US30 H4. This Analysis Based On Price Action Theory.
According to Multiple Analysis, We Can See That the Market has a Bullish Direction As Well As Market have Good Trend line support due to this market well keep move to Upside so on behalf of on that we have to target(resistance) @28816.62 & @29044.07
For More Confirmation, You can see that Bollinger Bands, Fib Retracement & Super Trend The Both are reflected Market Bullish Pattern wait for replacement
I Request to All Before The Trade You Also Match You're Analysis With As If You're Set up Match Then You Can Trade.
Thanks
Regard
shivamfx Technical Team
Note- Please Take Only Two ✌️ 2% Risk On Given Analysis

Dow Jones Index Sell Setup 💡 Price trades high from Sunday's open with inefficiencies, also much needed retest of the breakout zone/range. We seen a willingness to trade higher, just need attractive points for buyers to reload long positions.

US30 D1 #OutLook 22 September#OutLook 22 September
Dear Traders Today We Have an Analysis Of US30 D1. This Analysis Based On Price Action Theory.
According to The Analysis, We Can See That the Market On Bullish Pattern As well As Market Make Formation of the Ascending triangle pattern this indication of the market will move to continue buying But if the market will break out the trendline this indication of correction.
We have a Tow target level
1st for buying target(resistance) @28985
2nd for selling target (support )@24969
I Request to All Before The Trade You Also Match You're Analysis With As If You're Set up Match Then You Can Trade.
Thanks
Regard
Enclavefx technical group


Dow aka Us30 possible trade setup for July MonthHi,
US30 is not our trading script but it can affect the world market. Just tracking DOW to get an idea for our Market. Here is the July Month Possibility.


US30 LONG AFTER A 2,500 POINT DROP IN DOW JONESUS30 BUY SIGNAL BUY LIMIT Time Frame : H4
Entry ENTRY Price : $27048
Entry price 2: $26988
Stop Loss $26770
TP 1: $27448 & TP 2: $28048
TP.3 $28448 & TP.4 $28988
TP.5 $29348
The Dow Jones Industrial Average trimmed its loss in afternoon trading after plunging more than 2,000+ points as coronavirus pandemic fears intensified.
At its lowest point, the Dow (INDU) shed 929 points, or 3.3%, in the early ... The Dow is more than 8% below its most recent high, putting it close to correction territory.

US30 LONG SET UPUS30 BUY SIGNAL
BUY LIMIT
Time Frame : H4
Entry Price : 28843
Entry price 2: 28785
Stop Loss 28720
TP 1: 29033
TP 2: 29157
TP.3 29317
TP.4 29517
tp.5 29680
Status : PENDING

Dow Jones - Buy NowYes Dow Jone is in good for buy. Its already crossed the 0.786 fibo level and whenever price moving from down to upward in RSI and crossed the 64.34 (Blue horizontal line) its keep continue the bullish movement.
@ 26994 (this price can be change according to the broker)
TP 1 - 27120
TP 2 - 27135
TP 3 - 27150
SL - 26837
Note: Trade at your own risk high volatility and use money management.
Join with us for free signals
Telegram - t.me
Facebook - www.facebook.com
Twitter - twitter.com
Website - www.forexcaction.com

USD30USD 27,000 Rejection could lead to a 24,000 target With the rejection of our weekly midrange resistance (27000) on the daily timeframe we monitor the pullback or retracement to an area of support.
We are expecting price to reach (26143) at least but we prefer (26000).
Now if we do reach (26000) and manage to close below it on the monthly timeframe we can start to see the overall long term shift in price action. Then we will start to look for targets at (25000) and (24000).
This is the last week of price action before we end the trading month so keep that in mind when looking at you higher timeframe candlestick
Until then we would need to see a break and retest of our H4 ascending trendline and also support level (26500) to confirm the continuation of the lower timeframe shifting in price action.
If we get the break/retest our target is (26143) and (26000) for either this trading week or next trading month.
